Visualization and Analysis of Broadband Transient Absorption Data

Updated to work with current Helios (v14) and EOS software. Please continue to email with any comments or bugs.
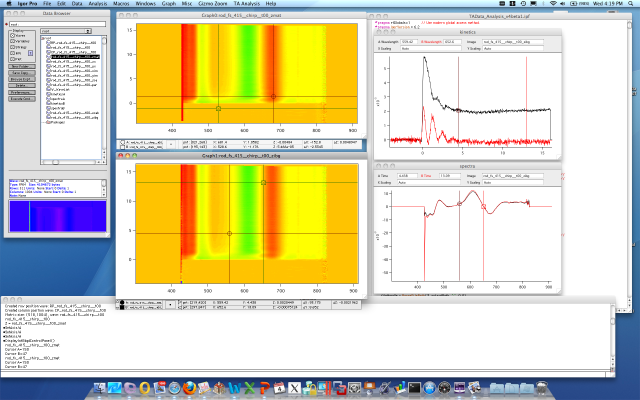
This package includes a set of functions for processing and graphing wavelength and time-resolved absorption data. This code was designed to process data created by the Helios Femtosecond Transient Absorption spectrometer produced by Ultrafast Systems, LLC. However, it will work with any data with the format:
0, time_1, time_2, . . . , time_M wavelength_1, deltaOD_1_1, deltaOD_1_2, . . . , deltaOD_1_M wavelength_2, deltaOD_2_1, deltaOD_2_2, . . ., , deltaOD_2_M . . . wavelength_N, deltaOD_N_1, deltaOD_N_2, . . ., , deltaOD_N_M where N, M are arbitrary integers.
Please note: this procedure requires that the MultPeakFit extension be loaded into Igor. For instructions, see the Igor help files or refer to the attached documentation.
This package is being produced to assist our external Users and collaborators with their data analysis and visualization needs. Current functionality includes the ability to:
- directly import *.csv files produced by data acquisition software and stores file info to the Igor notes area
- process those files to remove NaNs, Infs, and extra padding
- create waves in appropriate format for 2D image plots and 3D surface plots
- allow for quick inspection of kinetic and spectral data using cursors placed on the image files
- allow for easy extraction (single pixels or an average over an arbitrary range of pixels) and automatic plotting of 1D kinetic or spectral data
- process data to remove scattered light under degenerate pump-probe conditions
- extract a subset of data (region on interest) directly from an image plot using the cursors to bound the data
- allow for easy time zero correction of matrix and kinetic data
- generate a progressive time axis with arbitrary start and end points for use in acquisition software
- provide a set of commonly used curve fitting functions for first and second order kinetics
- provide a User-friendly and consistent interface to Igor's singular value decomposition and global fitting capabilities
- chirp correction routines!
- combine two data sets that share a common wavelength or time axis (with sorting and averaging of duplicates to make visualization work correctly)
- export a processed data set in CSV format
For instructions, please refer to the attached pdf documentation. This package is under active development, so check back soon!
Images:
Project Details
| Project Homepage: | View Homepage |
Current Project Release
Visualization and Analysis of Broadband Transient Absorption Data IGOR.7.00.x-4.8-beta1
| Release File: | TAData_Analysis_v4.8.beta_.ipf (103.58 KB) |
| Version: | IGOR.7.00.x-4.8-beta1 |
| Version Date: | |
| Version Major: | 4 |
| Version Extra: | beta1 |
| Version Patch Level: | 8 |
| OS Compatibility: | Windows Mac-Intel |
| Release Notes: |
Version 4.8-beta1: |

Forum

Support

Gallery
Igor Pro 10
Learn More
Igor XOP Toolkit
Learn More
Igor NIDAQ Tools MX
Learn More