Is it possible to generate chart with broken Y axis


Hi
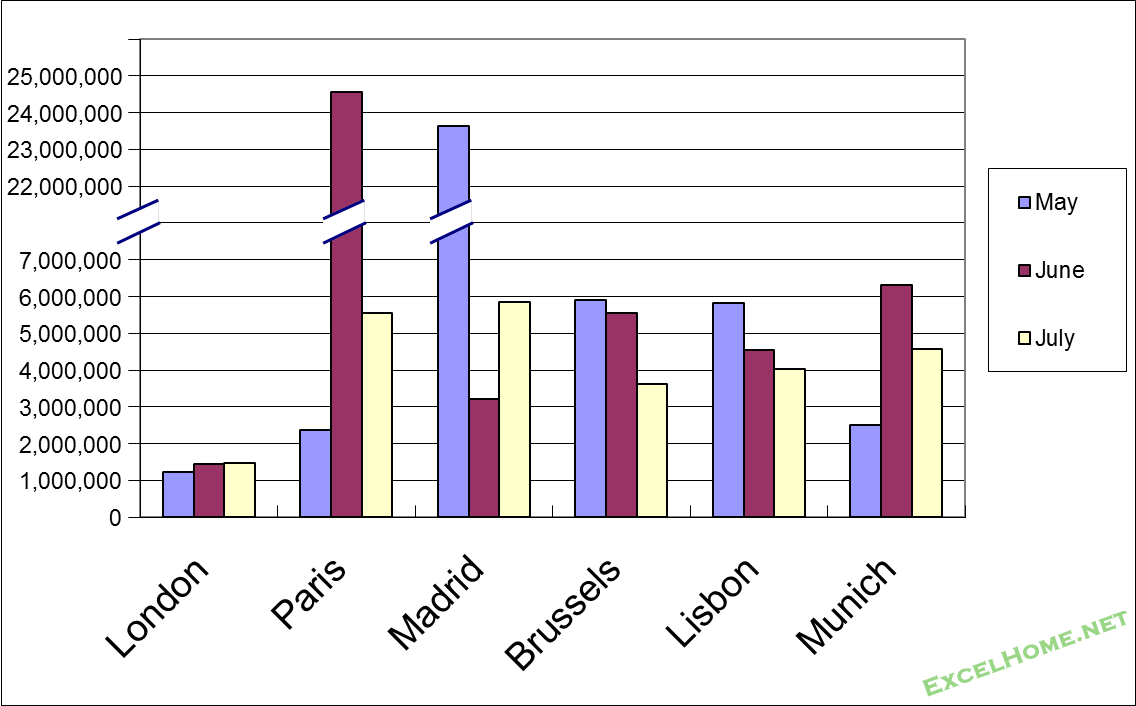
I have to say sorry about my poor English, and here's my question, is it possible to generate chart with broken Y axis, just like the attached image, thanks for your reply.

Forum

Support

Gallery
Igor Pro 10
Learn More
Igor XOP Toolkit
Learn More
Igor NIDAQ Tools MX
Learn More
One way to do it would be to use two left axes and draw only parts of them:
If you don't insist on the gap, a user tick wave might also do the job (but it somehow kills the message from the graph)
HJ
October 18, 2018 at 01:36 am - Permalink
In reply to One way to do it would be to… by HJDrescher
s.r.chinnAnother approach is to use the built-in WaveMetrics package for splitting an axis. In your Procedure file add
Then look under the Graph menu for "Split Axis Control". Once the axis has been split you can alter the different split region ranges by selecting each region and using the standard GUI dialog. This also provides the (optional) diagonal split marks.
October 18, 2018 at 02:39 am - Permalink
My question is more to answer "Why This Way?" than "How to Get it This Way?". Figure 3.15 of this book does a good job to illustrate why split axes graphs are misleading.
In that regards, have you considered simply using a log axis?
October 18, 2018 at 07:12 am - Permalink
In reply to One way to do it would be to… by HJDrescher
LE1202Thanks for your help.
And the reason for why this graph, our data are going to provide to some people who don't have professional knowledge, so we decide to show original data that they could easily know what happening by our chat, I'll check out the book, maybe we can find out some better way to show our data, thank you.
October 18, 2018 at 10:47 pm - Permalink
In reply to My question is more to… by jjweimer
johnweeksFor the uninitiated, a log axis can be just as misleading, making large values appear to be similar to order-of-magnitude smaller values. Dealing with a great disparity in values in a transparent and easily-understood way is a very tough problem.
October 19, 2018 at 11:09 am - Permalink
In reply to jjweimer wrote: In that… by johnweeks
jjweimerYes indeed.
October 20, 2018 at 06:31 am - Permalink