Spectra Trace Offset and Graph Size Tools - Quick-access to common graph and trace modify commands
This project provides panels and menu functions for quickly and conveniently changing traces and common graphs style options. The panels always operate on the top-most graph. You can bring another graph to the front and then switch back to the panel, which updates all settings automatically. Panels other than the Quick-Scale tool (which works directly on the data; see below) do not modify the underlying data unless explicitly told to do so.
The original code and the idea for the Offset Traces right-click menu has been kindly provided by Tony (https://www.wavemetrics.com/user/tony) from his StackTraces toolset. I tried my best to test everything thoroughly, but sometimes bugs slip through. Bug reports and suggestions for new features are always welcome.
Three menu entries are added to the Data Browser when right-clicking waves:
- If two or more 1D waves are selected:
Plot as XY pair - Plots one wave against the other. - If a 2D wave is selected:
Plot as Image - Creates an image plot in classic orientation (bottom x axis).
Plot as Waterfall - Creates a fake waterfall plot.
Append as Waterfall - Appends a fake waterfall set to the top graph.
The Graph Size panel
Use this panel to change the graph size, margins or axis labels and to apply style macros quickly. Changes are instant. Settings can also be copied and applied to other graphs. Start the panel by selecting 'Spectra Tools' → 'Graph Size Panel ...' from menu bar or by executing in the command line:
BuildGraphSizePanel()Here is a quick overview of all functions:
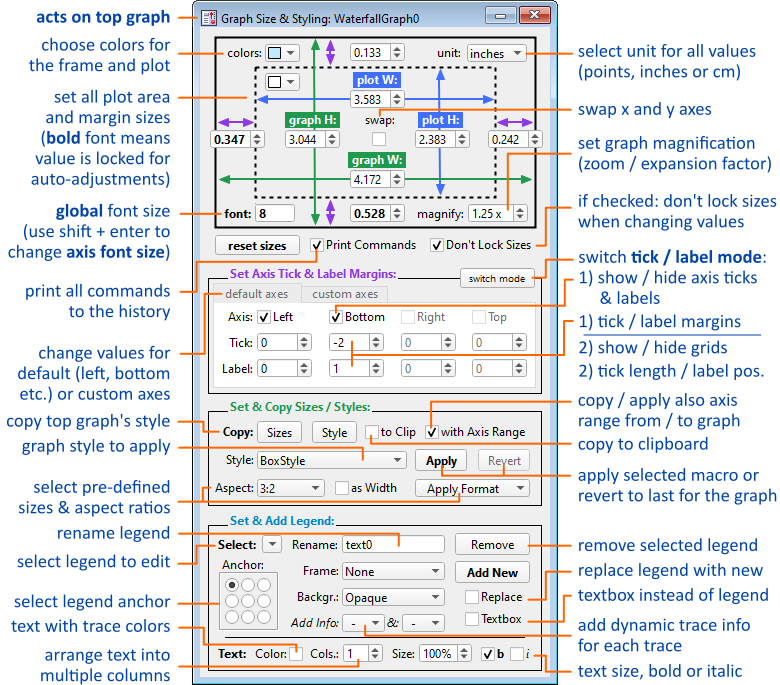
In the top-most area, you can set the graph's margins, plot area and graph sizes. In short, most settings of the Modify Graph dialog are recreated here for quick access. The current sizes are displayed even when the graph is in 'auto' mode (the Modify Graph dialog displays just 'auto' for a value), which is convenient for checking and easy modification of values. Furthermore, the overall graph size (plot area + margins) can be set directly (green arrows), which is not possible from the Modify Graph dialog.
Numbers rendered in bold font indicate that these values are fixed and do not adjust dynamically, e.g., when resizing the graph with the mouse. Insert 0 (zero) into the respective field to unlock the value (i.e., revert to 'auto' mode). If 'Don't Lock Sizes' is active, then changing the graph / plot area sizes will not fix these values but stay in 'auto' mode after adjustments are made. Margin sizes will always be locked upon setting a specific value, since margin sizes are predefined in Auto mode and cannot be modified.
The font value will adjust the global graph font size (as found in the Modify Graph dialog), or alternatively when holding the shift key the global axes font size (as found in the Modify Axis dialog). Font sizes specified for individual axes etc. override the global graph font size. The global graph font size will scale all fonts and adjusts margins etc. accordingly.
Activate the Print Commands checkbox to print most changes (other than Format or Copy/Paste actions) to the history. The magnify control changes the magnification of a graph, i.e., will enlarge / shrink graphs without changing their (physical) size.
Set Axis controls
This area contains controls for modifying axis labels and ticks via two modes. Use the switch mode button in the top right corner to switch modes.
Mode 1:
- the Axis checkboxes control whether the ticks and axis labels are displayed for the axis
- the Tick control changes the margin (distance) from the axis for ticks
- the Label control changes the margin (distance) of the label from the graph edge
Mode 2:
- the Grid checkboxes control whether a grid is displayed for the axis
- the Tick control changes the length of the ticks
- the Label control changes the offset (lateral shift) of the label against the axis
Set & Copy Sizes / Styles
This area is for copying and applying graph style macros. Select the desired Style in the drop-down box and press Apply to apply this style to the top graph. The project includes a standard style, named 'BoxStyle', which applies mirror axes and a few tweaks to graphs. Holding 'ctrl' (Win) / 'command' (Mac) will suppress the ticks and labels on the left axis while applying this style.
The graph can be reverted to the previous style by pressing Revert. This function only saves the state of the current graph when pressing Apply and Undo states for multiple graphs are not supported.
Copy Sizes / Copy Style save the size or style of the top graph for applying the same size / style to another graph. Here, the Sizes button specifically only saves size, margin and axis relevant settings to make graphs similar in size but the overall style is unchanged. The Style button saves the whole style (including font sizes, magnification etc.). A Copied Size or Copied Style will appear in the drop-down list, which can be applied to other graphs with the Apply button just like a regular style macro.
Activate 'to Clip' (or hold the shift key) to copy the style to the clipboard instead. This is useful for editing the style in a text editor before use or to apply the style in another Igor session. Choose 'From Clipboard' in the style selection drop-down list to use. If the 'with Axis Range' checkbox is active then the current x- and y-axis range limits are copied and applied as well.
The Aspect Ratio setting, as the name implies, sets the aspect ratio of the plot area (i.e., not including the margins) to certain common presets, such as 3:2 or 16:9. The default is setting the aspect ratio via the height. Use the 'as Width' checkbox if you instead want to set the aspect ratio via width constraint.
The Apply Format menu allows to quickly set the graph to common formats (useful for copy-pasting or graphics export):
- Paper Half / Full: Publication size figures of one column (3.25 inch) or double-column (7 inch) width.
- PPT 4:3 / 16:9: Power-point size plots for 4:3 or 16:9 format slides (full and half each).
Set & Add Legend
You can add to and, if already present, modify annotations in the top graph. Any changes will take immediate effect. The top-most (last) annotation is already selected when the panel is active. Select one of the other annotations (if available) by using Select: ▼. The Rename field shows the name of the currently selected annotation, and can be used to rename the annotation by changing name here. A warning will appear when the entered name is already in use. Use the Remove button to kill the selected annotation in the target graph. This works for any annotation, not only the ones created via the panel.
Choose the annotation anchor via the box with the 9 anchor points; these points represent positions within the plot area. Note that the annotation will be moved to the default location of this anchor immediately.
You can choose the display options (Frame and Background) as desired. By using the Add Info dropdown menu, it is possible to include trace information to a legend, such as offsets and scaling, which update dynamically.
Press the Add New button to create a new legend with the current settings. If the Replace checkbox is active then the selected annotation will be replaced by the new one. Select the Textbox option to convert the annotation into a textbox. Changes in the trace list are reflected in legends while text boxes stay unchanged, i.e., trace details will not be added or deleted dynamically.
You can choose additional text styling options: Activating the Color checkbox will color trace descriptions in the same color as the traces. Use this option after you have decided on the trace colors, since the colors will not update automatically. The Cols. option is for arranging the trace legend in multiple columns. This is useful if many traces are displayed, which would otherwise make the legend very tall. Use the Size option to enlarge / shrink the text.
Graph and Traces Right-click Menus
New functionality has been added to ...
- the marquee right-click menu (after you drag open a marquee box):
The options for the marquee menu use the x-range of the marquee to search for maxima or average values. The range (height) in y-direction of the marquee does not matter here.
- the trace right-click menu (which appears when right-clicking on a trace).
- the graph's right-click menu (when you right-click on an empty area of the graph):
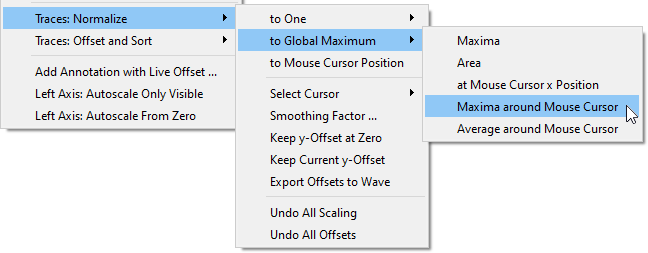
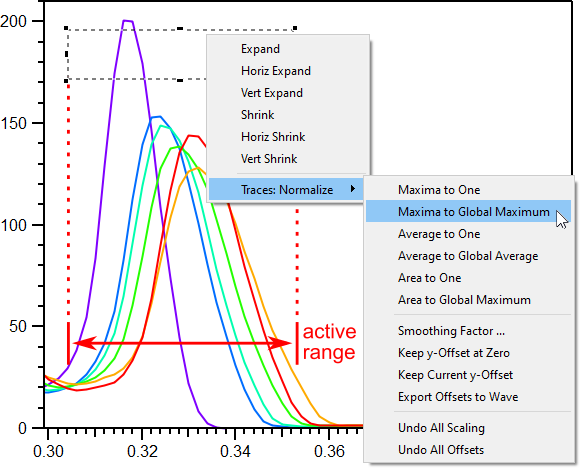
The 'Traces: Normalize' submenu:
This menu contains the following options and can be used to normalize traces to a common value via y-scaling and y-offsets. A subset of these options can also be found in the Spectra Tools main menu under Normalize Traces.
- to One - Normalize to y = 1.
- Maxima - Normalize to the maximum y-value.
- Area - Normalize area.
- at [Mouse, A, B, C...] Cursor x Position - Normalize to the y-value the data has at the cursor's x position.
- Maxima / Average around [Mouse, A, B, C...] Cursor - y-values are picked around the cursor position (in a range of 3 % of the data's full x-scale).
- to Global Maximum - Normalize to y = maximum of all traces (i.e., the trace with the highest y value stays unmodified).
- Same options as above but for the global maximum as target value.
- at [Mouse, A, B, C...] Cursor - Normalize to the y-value at the cursor position.
Options for normalization are:
- Select Cursor - Set the used cursor for above menu options.
- Smoothing Factor ... - The data will be smoothed before normalization if set. This helps with noisy data.
- Export Offsets to Wave - A wave named 'Offsets_GRAPHNAME' will be created in the current folder which logs the y-offset and scaling for each trace in the graph.
- Keep y-Offset at Zero - Each y-offset will be set to 0.
- Keep Current y-Offset - The current y-offset of each trace will not be altered.
Both "Keep ..." settings off: The y-Offset will be adjusted to bring the trace's baseline to zero.
------ - Undo All Scaling and Offsets - The offsets of all traces will be reset to 0.
The 'Traces: Offset and Sort' submenu:
This menu contains the following options, which all work with the current y-axis range of the graph. You may want to increase the y-range before applying these options for maximum effect.
- y-Order Traces Alphanumerically - Traces are rearranged according to their name in alphabetical order.
------ - Spread Traces Across y Range - Adds offsets to distribute traces across the current y-range (initial offsets are preserved).
- Spread Traces: Equal Offset - Adds equal offset steps to each trace to distribute traces across the current y-range.
- Spread Traces: Equal Gap - Adds offsets to each trace to distribute traces across the current y-range in a way which keeps the gap between traces (= maximum of previous trace to minimum of next trace) constant.
Furthermore, the traces right-click menu (when you right-click on a trace) contains the following additional functions:
- y-Offset: Align Traces Here - Offsets all traces so that they align at the cursor position. Hold ctrl / cmd to align to y = 0.
- y-Scale: Match Traces Here - Multiplies traces so that they align at the cursor position. Hold ctrl / cmd to scale to y = 1.
- y-Order Traces Here - Sorts the traces (trace display order in the graph) so that the y-value at the cursor position is in ascending order. Hold ctrl / cmd to sort in descending order.
Additional Options in the Graph Menu:
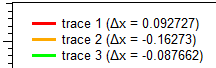
- Add Legend with Live Offset ...: This will add a default legend with extra information about trace offsets (x/y offset or x/y scale). A prompt will appear, which lets you choose the desired information, numerical precision and placement of the legend within the graph. This offset information is dynamic, which means that the displayed values get updated whenever any change happens. (Note: This feature adds a function named GT_LiveInfo() to the current experiment to achieve the effect. Don't delete the function or the display will not work.)
- Left Axis: Autoscale Only Visible - Sets 'Zero isn't special' mode for the y axis.
- Left Axis: Autoscale From Zero - Sets 'Autoscale from zero' mode for the y axis.
Waterfall plots and the Modify Traces panel
The main purpose of the Modify Traces tool is to adjust (fake) waterfall plots. Note that Igor Pro also provides an official package for creating waterfall plots (See: Windows → New → Packages → Waterfall Plot). This project instead creates (pseudo-)waterfall plots by offsetting traces in a graph, and is not compatible with the Waterfall Plot package. Invoke via the Spectra Tools main menu:
- Waterfall: Create from 2D Data or Folder - Creates a pseudo-waterfall plot from a 2D wave or a folder of 1D waves selected in the Data Browser (select one 1D wave inside the folder for the latter).
- Waterfall: Append 2D Data or Folder - As above, but appends the data to an existing plot instead.
- Apply Color to Traces - Applies up to 13 different colors to the traces in the top graph.
Start the Modify Traces panel by going to 'Spectra Tools' -> 'Trace Offset Panel ...' or execute:
BuildTraceOffsetPanel()The panel has two tabs for modifying all traces at once and for modifying individual traces. Here is quick overview of both tabs:
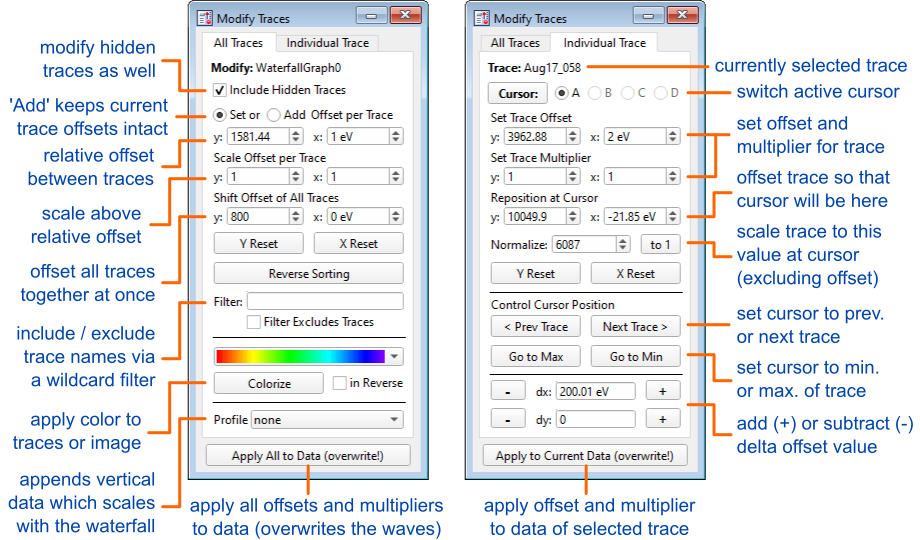
All Traces tab
Here all traces are modified at the same time. Traces can be omitted from modifications by hiding the traces (uncheck Include Hidden Traces in this case) or by a name Filter (see below). The top part is used to set the trace offsets in Y and X directions. There are two modes: The offsets are either Set (= the relative offset between traces will be exactly the inserted value) or Added (the relative offset is added to the already set trace offsets).
When to use the Scale Offset function: If you have offset the traces in the graph with uneven spacing (e.g., to represent some sort of relation between the traces) and only want to bring the traces closer together / space them further apart, then use this setting, which preserves the relative offset.
Reverse Sorting reverses the trace sorting in the graph, so that the bottom-most trace will be the topmost etc. afterwards.
Colorize will color the traces according to the selected range successively. This button works on images as well, but otherwise the panel is not very useful for image plots.
The Filter region can be used to limit the range of traces for which changes are made. If you enter, for example, 'atrace_*' (note the use of the asterisk wildcard here) then only traces which begin with 'atrace_' will be modified. If you check Filter Excludes Traces then traces with this name will be omitted instead. Lists such as "myTrace1;myTrace2;" and even lists including wildcards such as "atrace*;btrace*;" are accepted as well. You can right-click on the filter to get a list of all traces in the top graph for easy addition to the filter list.
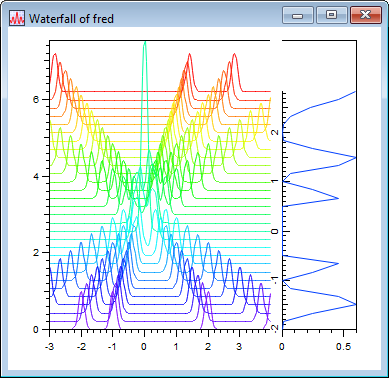
The Profile drop-down list can be used to vertically append a 1D wave for which the vertical axis extends to the upper end of the waterfall plot (the top-most trace). This is useful to show a certain trend or integrated data which is representative of the traces shown in the graph, and at the same time serves as the (third) waterfall axis. The axis of this profile is scaled together with the top trace when y-offsetting traces. Such an attached profile looks like this:
Individual Trace tab
The trace to work on is selected with a cursor (A-D), so you need to set at least one of these cursors onto the graph. Press the Cursor button to add a new cursor to the current graph (until all four available cursors are set). The active cursor can be moved between traces with the Prev Trace and Next Trace buttons.
The Go to Max and Go to Min buttons will place the cursor to the minimum / maximum y-value of the current trace. The cursor works also as a position indicator. With the Reposition at Cursor controls you can move the trace in X and Y to bring the point which the cursor is pointing at to a specific position. The trace can also be normalized to a specific y value at the cursor position (which scales the trace accordingly).
The Apply All to Data (All Traces tab) and Apply to This Data (Individual Trace tab) buttons will (try to) apply the offsets and scaling to the data (and then reset the graph offsets). This will overwrite the original data, so be careful! The applied offsets and multipliers are saved in the wave's note, which makes it in principle possible to reverse this action (this is not provided at the moment, but can be easily added if there is demand). Note that applying x-offsets to XY-data where all traces have the same x wave will likely give undesired results: Since the x wave is modified, all traces will shift over by the set x offset. These buttons do not work for graphs displaying 2D data sets at the moment.
Keyboard shortcuts (All Traces tab):
- ← → arrow keys = shift all traces left / right in x direction
- ↑ ↓ arrow keys = shift all traces up / down in y direction
- ctrl / cmd + ← → = change the offset between traces in x
- ctrl / cmd + ↑ ↓ = change the offset between traces in y
- Hold ctrl / cmd while using 'Scale Offset per Trace' to scale all offsets from zero instead of relative to the first trace.
Keyboard shortcuts (Individual Traces tab):
- a, b, c or d keys = select cursor A, B, C or D.
- h = set the active cursor to the maximum (high point) of the currently selected trace.
- l (small L) = set the cursor to the minimum (low point) of the trace.
- page up / down = move the cursor to the next / previous trace in the graph.
- ← → arrow keys = shift the trace left / right in x direction
- ↑ ↓ arrow keys = shift the trace up / down in y direction
- ctrl / cmd + ← → = scale the trace in x direction
- ctrl / cmd + ↑ ↓ = scale the trace in y direction
- shift + above controls = move in 10x larger changes per step
- alt + ← → = move the graph cursors instead of shifting the trace (with the graph in focus).
The dx/dy fields and user-provided update functions
The dx/dy fields at the bottom of the Individual Traces area are used to add (+) or subtract (-) constant values to the x / y offset of the selected trace using the respective buttons. Inserting a negative value will additionally invert the respective axis (the trace is flipped). The main use is to add or subtract pre-defined offsets such as the photon energy of a measured spectrum (in this case, addition/subtraction will remove or include the photon energy value to the energy axis).
These fields can be pre-filled with information from the trace's data using the TraceTool_FetchXShift() and TraceTool_FetchYShift() functions, which are called upon selecting a different trace or graph. You can modify these two functions directly at the beginning of the procedure file, but it is more convenient to provide your own code in a separate file or inside the experiment environment. Use the Override keyword in front of the Function statement to override the standard definitions inside the package. The following code shows the current implementation inside the project’s procedure, which is used to extract a photon energy value from the data:
static Function TraceTool_FetchXShift(WAVE input, string &unit)		// optional unit string
    variable val = NaN							// the shift value
    string notes = ReplaceString(" =", ReplaceString("= ", note(input), "="), "=")
    if (numtype(val))
        val = NumberByKey("Xray energy", notes, "=", "\r")  		// find the photon energy
    endif
    if (numtype(val))
        val = NumberByKey("photon energy ", notes, "=", "\r") 	 	// try another key
    endif
    if (numtype(val))
        val = NumberByKey("Excitation Energy", notes, "=","\r") * (-1)  // try another
    endif
    unit = "eV"
    return !val ? NaN : val // return NaN for no change / negative values for axis inversion
End

static Function TraceTool_FetchYShift(WAVE input, string &unit)
    return NaN
End
The Quick-Scale panel
This panel attaches itself to the top graph and provides a sub-set of the functionality of the Trace Offset panel. All changes are immediately applied to the data (i.e., the wave is directly modified) and images are supported as well. Attach the panel to a graph by choosing 'Spectra Tools' → 'Attach Quick-Scale Panel ...' or executing the following in the command line:
AttachQuickScalePanel()Here is an overview of the controls:
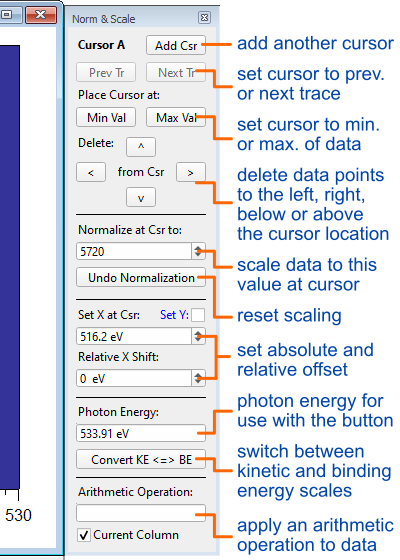
The panel works with the current cursor (the cursor which was moved / placed on the graph last) to select the trace or image point to work on. If there is not cursor yet then you can add a new cursor to the graph by pressing the 'Add Csr' button in the panel. The cursor can be moved to the previous or next trace in the graph by using the 'Prev Tr' and 'Next Tr' buttons. The Min Val and Max Val buttons move the cursor to the position of the minimal or maximal data value (either of the current trace or image).
The Delete buttons < (left), > (right), and also ^ (up), v (down) in case of 2D data, can be used to crop the data by deleting all data points, left or right (above or below) the current cursor location. Note that this change cannot be undone. Work on a backup if you want to preserve the data for later.
The Normalize at Csr to field shows the intensity at the cursor location. Dial in a value here and the data will be multiplied so that the cursor position will end up at this value. The Undo Normalization button reverts this change.
The data scaling can be changed by modifying the Set X at Csr parameter, which changes the x-scaling so that the cursor ends up at this position. The Set Y checkbox switches to y-scaling for images (2D data). You can adjust the Relative Shift from the initial position as well.
The KE <> BE button switches between kinetic / binding energy scales for photoelectron spectra or emission energy / energy loss scales for (X-ray) emission spectra. For this, you need to first provide the correct Photon Energy. The photon energy value is read automatically (if available) from the data by utilizing the TraceTool_FetchXShift() function explained further above.
The Arithmetic Operation field provides functionality to add, subtract, multiply or divide the data by a value or simple function. The expression should start with the +, -, * or / character. Otherwise, it works the same as if you would write the expression into the command line (e.g., entering '/3' is the same as executing 'mydata /= 3' in the command line). The operation will only work on the current trace or selected column (for an image). If you uncheck One Column then the operation will be applied to the whole image.
Using Trace Normalization from the Command Line
You can also normalize all traces by directly calling the ScaleAllTraces() function. This function has optional parameters to modify the result. If called without any parameters then all traces will be scaled between 0 and 1 on the main y-axis:
ScaleAllTraces([name, smth, xpos, ypos, normMode, offMode, rangeMode, xRange, relRange, csr, export])The options are:
- name = the target graph's name
- csr = cursor name such as "A"
- smth = smoothing (factor) before normalization
- xpos = center coordinate for limited-range normalization
- ypos = optional target y-value
- normMode = how to normalize: [0] = to one, [1] = to global max, [2] = to given y-value, [3] = area to one, [4] = area to global area
- offMode = how to handle offsets: [0] = to zero, [1] = no offset, [2] = keep offset
- rangeMode = use range around xpos: [0] = off, [1] = find maximum, [2] = calculate average
- xRange = absolute x-range around center position
- relRange = relative x-range around center position (1 = 100 %)
- export = if set, exports wave with y-offsets and scales
Project Details
Current Project Release
| Release File: | Graph Tools_v2.37.zip (51.98 KB) |
| Version: | IGOR.8.00.x-2.37 |
| Version Date: | |
| Version Major: | 2 |
| Version Patch Level: | 37 |
| OS Compatibility: | Windows Mac-Intel |
| Release Notes: |
|

Forum

Support

Gallery
Igor Pro 10
Learn More
Igor XOP Toolkit
Learn More
Igor NIDAQ Tools MX
Learn More
nice project.
a little bug: if cursor is on an image in the top graph an error occurs when the panel is built.
March 9, 2021 at 03:20 am - Permalink
Tony, thanks! Oops, I have fixed this now. Somehow I had checking for images in place but commented out. I will look into working your StackTraces functions into this package, so that everything is neatly in one place. Thank you for your manual in the other thread.
EDIT: Now I know why I had commented this out: Because it was not working properly. The current version should work fine with image plots (i.e., no error message). Of course the panel is not that useful for images yet. I have another small panel which can shift image data around, but this involves changing the wave's scaling, since there is no offset option for images. I could implement this in the future. Would you find shifting and scaling images useful?
March 10, 2021 at 06:32 pm - Permalink
Hi Tony,
I went now through your StackTraces code. I found it very useful and have modified (reinterpreted) it with some new functionality. I would like to put this into the next GraphTools update, but first I would like to hear your opinion. Does the new version still work well with your workflow and data? If you look at the code you will see that I have rewritten a lot of details. This is my way of translating the functionality so that I understand what is going on (this included renaming menu entries a bit... I couldn't really wrap my head around the word 'stack' for most of the options). Also, I want to keep Igor 6.3 compatibility as much as possible for now.
The code is now useable with 2D waterfall plots and honors x-offsets as well as y-scaling (I don't have x-scaling awareness in yet, but this will hopefully not be a problem). Now it is also possible to scale all traces (set a multiplier) to the same value at the cursor position. I have taken out addOffsets(), since this is probably already covered with the panel (if you find this more convenient this tool could go back in, of course).
I have added alternative functionality when ctrl / command is pressed:
Please let me know if you have any comments or suggestions for improvements.
March 12, 2021 at 08:53 am - Permalink
@Tony: I went ahead and merged the right-click menus into the project. I hope you like it. :)
March 16, 2021 at 02:05 am - Permalink
I do like it!
The thing I still look for in the panel is 'shift offset per trace', the equivalent to the equivalent of my 'add offsets per trace' graph menu.
Something that will add an additional offset of value*i to each trace. Is there a way to do that? Perhaps I'm missing something.
March 16, 2021 at 04:33 am - Permalink
Great! Let me know if I should add something else.
The 'add offsets per trace' functionality is implemented in the panel as 'Set Offset per Trace' in the top right corner for both x and y directions. Just dial in a number or user the up/down arrows. This will add the inserted number as value*i to the traces. Also, 'Shift Offset of All Traces' will add the same offset to all traces, i.e., shift the whole bunch.
March 16, 2021 at 05:23 am - Permalink
I was trying to add rather than set the offsets. So the result is current offset + i*value.
The idea is to able to quickly 'align' the traces by setting variable offsets, then add something to each offset to spread the traces apart from one another, with the possibility of adding or subtracting a bit more to spread them further or closer to one another.
It looks like 'set offset per trace' discards the current offsets, ie it does what it says!
March 16, 2021 at 08:13 am - Permalink
Ah I see! Yes, the initial offsets and any alignment are not preserved. It should be no problem and make no difference for me to convert this into an add offset function. I'll think about it.
March 16, 2021 at 08:51 am - Permalink
Here is a version where I have added checkboxes to toggle between Set (the current behavior) and Add modes (this should recreate the 'add offsets per trace'). :) Let me know how well this works for you. If everything is fine then I will submit an update after doing a few more tests tomorrow.
As a somewhat related side note, you may be shocked to hear that I have opened the All Traces Popup menu for the first time today. One learns something new every day. ;-p
March 16, 2021 at 10:17 am - Permalink
My packages supports menu keyboard shortcuts which are loaded from a settings file. If you want to add keyboard shortcuts to common menu entries, place the content (Spectra Tools settings.dat) of the attached zip file in the same folder as the package procedure and edit as necessary.
July 27, 2023 at 11:56 pm - Permalink