Tracer

Tracer is a utility for digitizing data from images of graphs (which could be screenshots, scans, or graphics copied from another application and loaded from the clipboard). The interface includes tools for setting the image scale so that coordinates match those of the graph in the image. In X-scan mode, data are created in an attempt to follow a trace from left to right across the image between endpoints marked by cursors, and the data are extracted at the resolution of the image (one data point per pixel). In equal step mode, a step-length (number of pixels) is selected and the tracing is accomplished by scanning pixels in an arc with a radius of the chosen step-length. When the trace does not form a continuous path between the cursors (owing to poor image resolution, crossing lines, or dashed or dotted line types), the procedure attempts to search for the next line segment. Tracer distinguishes between different trace colors.
In addition to the automated data extraction methods, you can use Tracer to digitize data as individual points picked manually from a graph image, or to draw curves over the image and turn the curves into waves. Tracer has two methods available for curve drawing: the curve option found in the Manual Points section, and the Bezier to Wave method which transforms Bezier drawing objects into waves.
For manual point picking, you might also want to check out the Wavemetrics procedure IgorThief (Look under File > Example experiments > Techniques > Trace Graph), and KZarzana's updated version, IgorThief2, which is available here on IgorExchange. The two IgorThief procedures can correct for image skew, while Tracer is limited to images where the graph axes are parallel to the image edges.
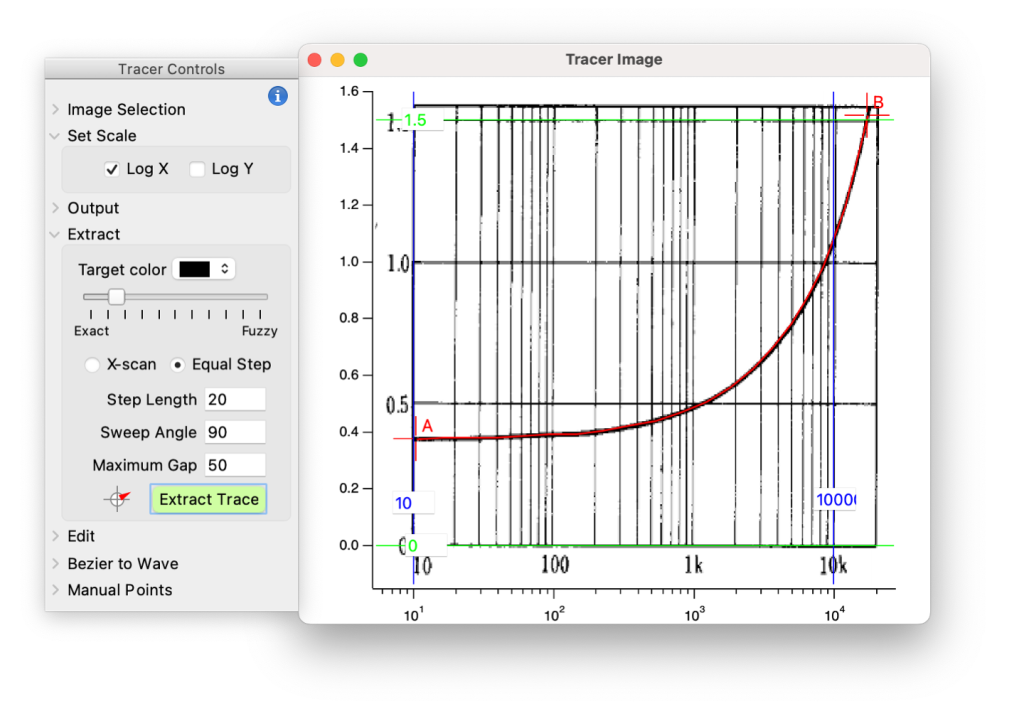
How to use Tracer to extract a trace from an image:
- Select Tracer from the Data menu.
- Load and display an image using the buttons in the Image Selection area of the Tracer panel. The load dialog also allows an image to be loaded from the clipboard.
- Unfold the 'Set Scale' controls to add two pairs of horizontal and vertical cursors to the plot. Drag the cursors to known positions at the ends of the plot axes, then type the axis values in the SetVariable controls. Make sure the cursor positions are accurately reported before moving on.
- Output: Select a name for the wave that will be created with the extracted data.
- Select trace color in the Extract area of the Tracer panel. To sample colors from the image, look for the eye dropper icon in the color-picker dialog.
- The 'fuzziness' slider affects how picky the tracer is about colors. You may have to adjust this setting for tracing to work.
- Place cursors A and B at start and end of a trace and click on 'Extract Trace' to start digitizing. If you hold down the control key (command key on Mac) as you move a cursor the target color will be set to match that of the cursor pixel.
- Play with the gaps, jump threshold, and minimum range settings (or step length, sweep angle and maximum gap settings for equal step mode) to deal with incomplete lines and other problems.
- If you're tracing a series of open symbols, use the minimum range setting to avoid tracing the symbol stroke.
- If needed, you could use interpolate to clean up your traced data.
If you want to help Tracer to take the right path where traces cross one another, you can use the image editing button to touch up the image. Hold down the control/command key and click with the mouse to paint pixels with the selected color. Expand the graph view for more detailed editing. Use command/ctrl and scroll to zoom in and out, hold the shift key to accelerate zoom.
If tracing fails, be sure to try changing the fuzziness, jump threshold/sweep angle, and gap settings.
Project Details
Current Project Release
Tracer IGOR.8.00.x-5.84
| Release File: | Tracer584.zip (38.45 KB) |
| Version: | IGOR.8.00.x-5.84 |
| Version Date: | |
| Version Major: | 5 |
| Version Patch Level: | 84 |
| OS Compatibility: | Windows Mac-Intel |
| Release Notes: |
Minor UI tweaks |

Forum

Support

Gallery
Igor Pro 10
Learn More
Igor XOP Toolkit
Learn More
Igor NIDAQ Tools MX
Learn More
Hi Tony,
this is awesome! IgorThief is one of my favorites, but extracting smooth curves from plots is always a bit tricky!
Thanks a lot!
Christian
Edit: Just realised that this exists quite a while! Shame that I missed this all the years!
October 15, 2020 at 10:55 pm - Permalink
Hi Tony, I use the tracer package for some years now and like it a lot! I have two suggestions for improvements:
1) If I want to extract several traces from a graph, I usually first prepare a separate picture for each trace and color the trace I want in a distinctive color. Then I load the pictures successively and extract each trace. Since the size of each picture is exactly the same, I reuse the assigned scale. Currently, I have to dive into the package folder and copy over the scale manually. It would be nice to have a method to apply scales from one picture to another in the panel.
2) I am someone who wants to be extra precise, so I zoom in when placing the cursors. It would be nice to have a magnified view around the mouse cursor always open (also showing the cursor placement), to avoid this step.
January 31, 2021 at 06:45 pm - Permalink
In Version 5 you can right click on the image to copy and paste image scaling. See the notes in the file header for other changes.
February 19, 2021 at 07:26 am - Permalink
Tony, thank you for this great update! Looks very sleek. One detail, though: Using the alt key on windows does not work because alt enables the image drag mode, so s.wheelDy seems to get eaten. Using shift (s.eventMod&2) instead would work fine.
February 19, 2021 at 11:01 pm - Permalink
Rats. I started out using cmd-shift, but I find that when using my mouse the shift key transforms dY to dX. That doesn't happen with the trackpad, so the code wouldn't work for both. I tried using cmd-shift + max (dX, dY), but then the zoom gets jerky when dX ~ dY. The cmd-option key combination seems to work fine on mac, despite option being the drag key. That's frustrating, because I've very quickly grown used to scroll-to-zoom. It works okay with just the control key, right?
February 20, 2021 at 12:29 am - Permalink
Tony, no problem. A workaround would be to use Option on Mac and Shift on Win, but control-key only works good enough.
February 20, 2021 at 02:31 am - Permalink
Hi Tony, first let me thank you for this excellent tool! I stumbled on a possible issue lately: I happened to name the trace output exactly the same as the input image. You can image this screws up the setup with the image being suddenly gone. It would be good to prevent naming the trace the same as the image when the input and source folders are the same. Also, it would be great if the initial trace name could be some derivative of the input image name upon loading the image, such as 'imagename'_trace0.
June 4, 2023 at 03:24 am - Permalink
@chozo,
I added your suggestions in version 5.74
June 4, 2023 at 08:01 am - Permalink
Wow, that was quick! Thanks a lot.
June 4, 2023 at 08:04 am - Permalink
Hi Tony
Additional thanks for an awesome package. I did find a small bug in the RebuildGraph function. The calculation of the TracerLogX wave doesn't look right. In the attached experiment, if you toggle the Log X checkbox from on to off and then back on, the cursor positions aren't right. I think if you replace this line
with this
then it works fine.
August 16, 2023 at 01:18 pm - Permalink
The problem was that stored values for the high and low ends of the axis were reversed when the image scale was set. Version 5.75 should fix it.
August 17, 2023 at 02:39 am - Permalink
hello:
in the update, I saw the "bexier to wave", and I tried the new feature several times. but I find that in the case of the log axis, things are a little weird.
The extracted result is offset between each segement point. I can not understand this situation.
September 17, 2023 at 07:31 pm - Permalink
Hmm, I see what you mean.
I attempted a quick fix. Try version 5.76.
September 18, 2023 at 05:18 am - Permalink