Knowing about plotting three waves against each other as a 3D plot


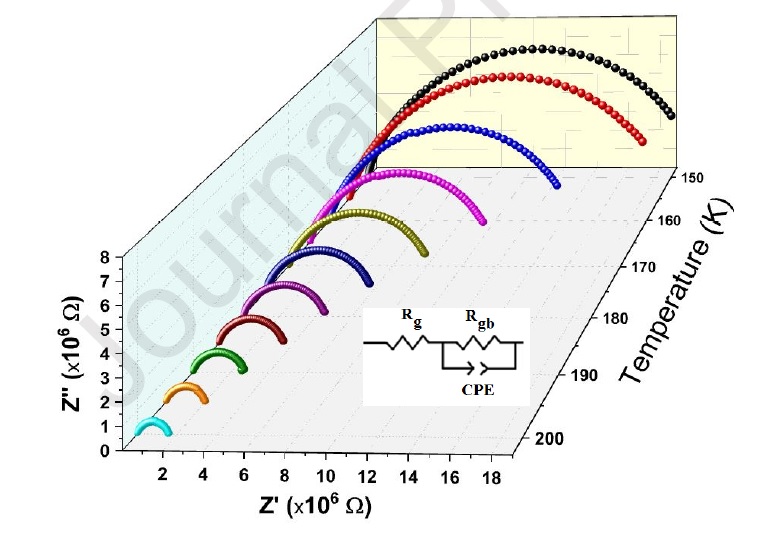
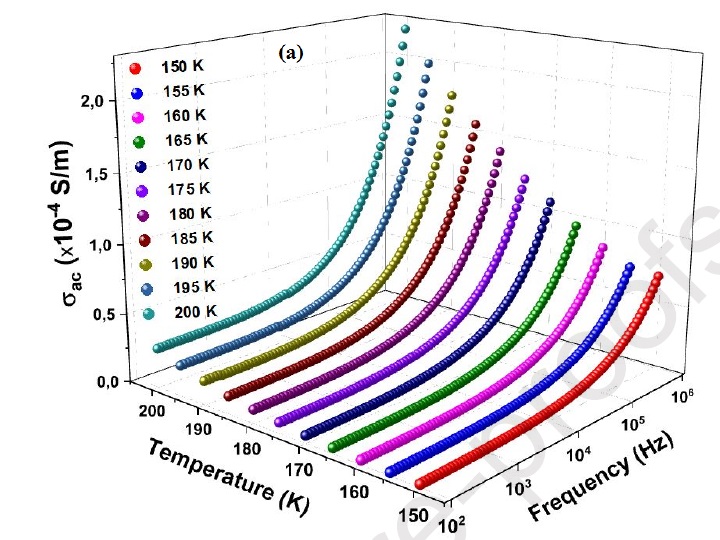
I am new here. Sorry in advance if the question would be below limit. I have data for three different quantities and I want to plot them against each other along three axes X, Y and Z as a 3D plot. Igore provides option for two axes X and Y. How could I go for the 3rd Z-axis. I want to plot a graph like as attached in file..Please guide me how can I plot the data as shown in the file.

You need Windows -> New -> 3D Plot
type this in the command window:
April 8, 2020 at 03:12 am - Permalink
When I go through windows-new-3D and then follow the procedure, I don't get the option for the 3rd axis (Z-axis). Can I know the complete procedure?
April 8, 2020 at 07:18 am - Permalink
In reply to When I go through windows… by javedbinyousuf
tonyOpen the help file by following the directions above and scroll down to Gizmo Guided Tour. There you will find the 'complete procedure'.
April 8, 2020 at 07:24 am - Permalink
In reply to Open the help file by… by tony
tonyProbably you will want to make a '3D scatter plot'
April 8, 2020 at 07:29 am - Permalink
Possibly you want a "waterfall" plot. The interface isn't particularly polished: Windows->New->Packages->Waterfall Plot. To learn more about waterfall plots, copy this command, paste it into Igor's command line and press Enter: DisplayHelpTopic "Waterfall Plots".
With either the Gizmo plot or a waterfall plot, you may need to rearrange your data a bit. I'm not sure about that, as your posting didn't include information about how your data are laid out.
April 8, 2020 at 09:16 am - Permalink
You are not telling us which version of Igor you are using. If you are using IP8 I recommend that you use Gizmo; I don't think that the standard waterfall plot would give you graphs similar to what you posted.
There are two object types in Gizmo that are useful in this application: Path and Scatter. Both objects require data in the form of a triplet wave, i.e., a 3 column wave where each row is an XYZ triplet. The Path object draws a 3D path by connecting the points corresponding to consecutive XYZ triplets. The Scatter object simply draws a 3D marker (e.g., a sphere) at each triplet location. You can combine both to show both a line and markers at the data locations.
If your data is in the form of columns of z-values you can write a short function that creates for you the necessary triplet wave(s). Feel free to contact support@wavemetrics.com if you are not sure how to proceed.
April 8, 2020 at 09:40 am - Permalink
In reply to You are not telling us which… by Igor
javedbinyousufThank you for your reply. I am using Igore 6.1.1. My data is in form of three waves: wave0, wave1 and wave2 pasted in three columns in the table in igore. The data is for three different variables which are to be plotted in form of 3D curves as I have already shown in the attached images. My problem is like as for 2D plot we go to windows->new graph->y-wave & X-wave->do it. Similarly here in my data case I have an extra wave2 in addition to wave0 and wave1, but in igore I don't find the option for the Z-wave(z-axis) as I found for the X and Y-waves. Now Z is a function of x and y but the expression relating x and y to give Z is unknown. I simply want to plot XYZ-coordinate system by wave0, wave1 and wave2. Please guide me with this background and iff possible tell the procedure for this.
Thanks in Advance...
April 8, 2020 at 11:25 am - Permalink
Igor 6.1 is really too old. I encourage you to upgrade to IP8.
In general Gizmo requires triplet waves for Path or Scatter objects. You can create the triplet wave using, for example,
Once you have this wave you might be able to proceed. Also note that you do not have to find enabled menus. Just execute on the command line:
and proceed to interact with the Gizmo Info Window.
Note that all this has been completely redone in the last ~10 years so I encourage you to upgrade.
April 8, 2020 at 11:36 am - Permalink
Thank you WM igore and tony. I have successfully plotted in accordance with my above said demand by Gizmo scatter plot interface of igore as my plot is attached here, but here I request the followings:
1) How to enlarge the axes length geometrically but within the same limit of data point (e.g if data goes along an axes min=1 to max=10, it remains same and the visionary length could be enlarged), (remember it can not be done by Gizmo ->Axis range and not by Display List ->axes0)?
2) How to set the stroke color for Gizmo scatter plot as we do for windows ->New Graph by properties -> stroke color (Remeber there is no option for stroke color in Display List ->scatter ->color)?
3) How to draw tools such as line, circle or rectangle to indicate some feature on the graph as we do for windows ->New Graph by ctrl+T by tools (Remember there is no option for line or circle draw in Gizmo through tools i.e by ctrl+T)?
April 11, 2020 at 04:36 pm - Permalink
The following instructions apply to IP8:
1. To adjust the length of an axis, click on the Gizmo window and you will see a Gizmo menu in the menu bar. Then select Axis Range from the Gizmo menu.
2. You have many options for setting the color of the scatter. Double click on the scatter object in the Gizmo Info window and you will get a dialog that allows you to set the various properties of each scatter object. You can select fixed color (as appears in your example), you can use a colortable with colors changing as a function of z. You can provide a color wave where you select the individual RGBA color for each scatter marker. Other options also exist but it depends on how you want to display the scatter.
3. You can append an annotation but you can't (easily) associate it with a particular trace or maker. Gizmo supports line objects so you can always add a line between any 3D points. You can draw a circle if you want but this is rarely needed because you can draw a full 3D sphere.
4. If you really want your graph to look good I recommend replacing the built in sphere marker with a user defined hi-resolution sphere and finally execute:
I hope this helps,
A.G.
April 11, 2020 at 09:58 pm - Permalink
From which menu I can reach to user defined hi-resolution sphere?
April 16, 2020 at 05:38 am - Permalink
You can create a sphere object in the object list. To do so click the + button at the bottom of the object list in the info window and choose "Sphere". You will be presented with a dialog that allows you to create a sphere of any resolution. You can also use the command line, e.g.,
Next, double click on your scatter object icon in the info window. In the Scatter Properties dialog choose the Shape and Size Tab. Under shape use Fixed Shape but select "Object" from the menu. This will give you another menu that contains a list of available objects. Choose Sphere0 (or whatever name you used for the high-resolution sphere). The equivalent commands for this are:
At this point you will more than likely find that the sphere radius is too large. This is something you can change in the scatter dialog Shape and Size Tab. Set size to 0.1 for example. Here the equivalent command is:
When you are done with these modifications make sure to execute:
I hope this helps,
AG
April 16, 2020 at 09:15 am - Permalink
Thanks a lot..
Now tangled in:
How to set log scale (for a wave along an axis) in Gizmo plot?
April 24, 2020 at 12:36 am - Permalink
My demo version igore pro 8 limit has reached and now I can not proceed by this version...How Can I get igore pro 8 for unlimited use and within how many days with what price?
May 13, 2020 at 02:21 am - Permalink
You can purchase from https://www.wavemetrics.com/products/igorpro. Select your license type towards the top of that page and you'll see pricing below. Student, coursework, and annual licenses are 1 year. Otherwise, you're buying a perpetual license.
May 13, 2020 at 05:13 am - Permalink