Color coding waves


Hi, I am an undergrad new to Igor.
I want to make a function that goes through my data (in this case, the y values) and categorize whether the value passes a certain threshold or not and then create a new color-coded graph based on that threshold.
The problem is, I don't know how to write a function that goes through a table on Igor and can't seem to find the tutorial. Oh, and also how to add those categorized data into a new table.
If my explanation is not sufficient, please refer to my illustration.
Thanks!
If I understand correctly, you want to make a plot where some regions are plotted in a different color. In that case you probably want to use the f(z) option for color.
Execute for an example:
You might consider plotting colored markers over a line-between-points plot. Further customization is possible if you plot subsets of data separately.
September 1, 2022 at 05:32 am - Permalink
Tony, I was thinking the same and tried it, but realized that this does not give a clean result. If you look closely, the full next line segment is in a constant color if the starting point is below/above the threshold. If the data is sufficiently coarse this almost defeats the point. Try for example
with your snippet. Do you have any good alternative where the lines are colored appropriately above and below the threshold? To make it clean one could split the data at the threshold, but this is already a small coding job.
September 1, 2022 at 05:53 am - Permalink
I'm not really sure if I understand the "fooColorIndex" part correctly, I tried doing that with my wave but it does not compute.
I may have done a bad job explaining, my bad. I am trying to color the section of the data based on Gaussian distribution, I did the computation to find the coefficients, that part was fine.
I can give you my data if that helps. Its a displacement vs time graph.
Sorry for taking your time, thank you everyone.
Kind regards,
Sam
September 1, 2022 at 06:16 am - Permalink
Yes, that was probably a bit too minimalistic example. But we are also still figuring out the best way to help you. What Tony posted was basically the command-line version of a 'Color as f(z)'. See here:
You can play around with this in the menu as well by double-clicking on a trace in a graph and then choosing f(z) as color.
Your error is relatively unrelated to this and rather dips into programming. In short, you are using variables that are declared in a different function, which will not work. Basically you would need to declare and fill your variables within GraphwithRegion(). To get a better understanding of all this, I recommend you to also read about about creating functions, starting here:
Of course, we are happy to help you resolving any errors, but often enough it is faster overall if you know to avoid a few things yourself. Hope that helps.
September 1, 2022 at 06:37 am - Permalink
In reply to Yes, that was probably a bit… by chozo
tonyHow about using a fill to shade the regions of interest? Something like this?
September 1, 2022 at 07:59 am - Permalink
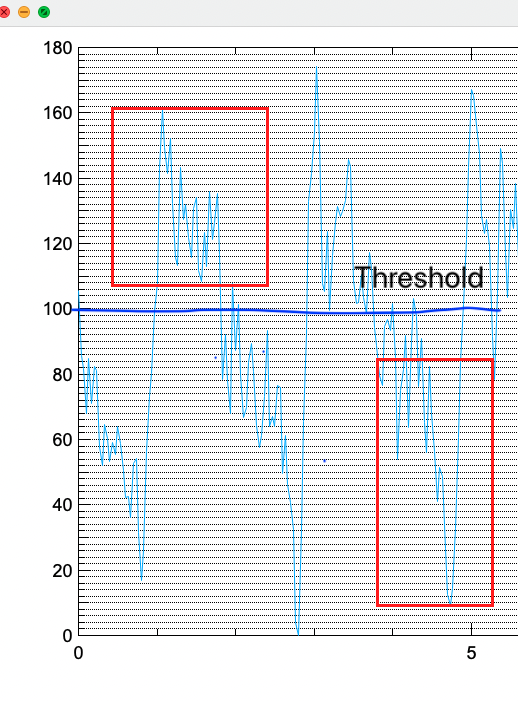
Hi everyone, thank you for the help. I decided it was easier to just create a horizontal line to implement the thresholds.
However, right now I want to register the peaks that passes through the upper threshold/limit, and I am not sure how to do that.
Is it possible to go through every data in the table (in this case, wave10) and append said data to a new table if it passes the threshold?
Or Is there a better way to do this?
Thanks.
September 5, 2022 at 06:13 pm - Permalink
This is actually very easy. Look up the help for the Extract command. For example, try this:
This extracts all points which are greater than 3 and smaller than 10 from the wave 'test' and puts the result in wave 'result'.
If you instead just want to find the exact location where the data passes the threshold, you should look up FindLevel (or FindLevels) instead.
September 5, 2022 at 07:42 pm - Permalink
Thank you!! that works like magic!!
Sorry to ask another question,
Is it possible to extract together with the other axis?
September 5, 2022 at 08:29 pm - Permalink
For this you need Extract/INDX in a small function. Here you go:
Paste this code into you procedure window and then run the function in the command line like this:
Note that this function always saves the output into the two waves 'result' and 'result_x'. If you extract multiple ranges you should rename them (this can be implemented into the function as well, but I kept it simple for now).
September 5, 2022 at 09:03 pm - Permalink
Thank you so much!!!
September 5, 2022 at 09:27 pm - Permalink