Marquee Peaks

A user interface that uses the graph marquee as an efficient way to select an x-range in order to make quick estimates of peak parameters.
This is based on code that I've used for many years before cleaning up and posting here. Most of these parameters could be equally well determined by positioning cursors and using command line or quick fit menus, but I find the graph marquee to provide an especially efficient interface for selecting regions of interest. For more advanced decomposition of overlapping peaks Igor's multipeak fitting package works well, and global fitting is useful for fitting with linked coefficients. But, when you have many spectra plotted in a graph and want to produce just a quick list of peak heights for all of the traces, you may find Marquee Peaks to be helpful.
Most of the Marquee Peak functions use the graph marquee to select a subrange of a plotted trace. They're used to determine peak heights, areas, centroids (centres of mass), and full-width at half-maximum (FWHM). Right click within the graph marquee to select which of these you want to calculate. When a trace is selected from the list of traces that pass though the marquee, the results of the calculation are written to history and shown in a tag on the graph. Select the 'clear' submenu to remove tags from the plot.
Spectra must be baseline-free for these functions to be useful! Fit-derived uncertainties are not necessarily meaningful.
Peak height: fits a third order polynomial through the selected range, and then tries to find the peak by looking for the first zero-gradient within that selected range. For this to work nicely you should select a narrow region around the peak. I used a polynomial so that it should work with asymmetric peaks. Also gives peak position.
Area and Centroid: integrates the data over the selected range and calculates both the centre of mass and the position of area/2 in the integral wave. Also gives area.
Peak fit: Selects the best fit from Gaussian, Lorentzian and Voigt over the selected x-range. Gives peak height, FWHM, area, and position for the best fit.
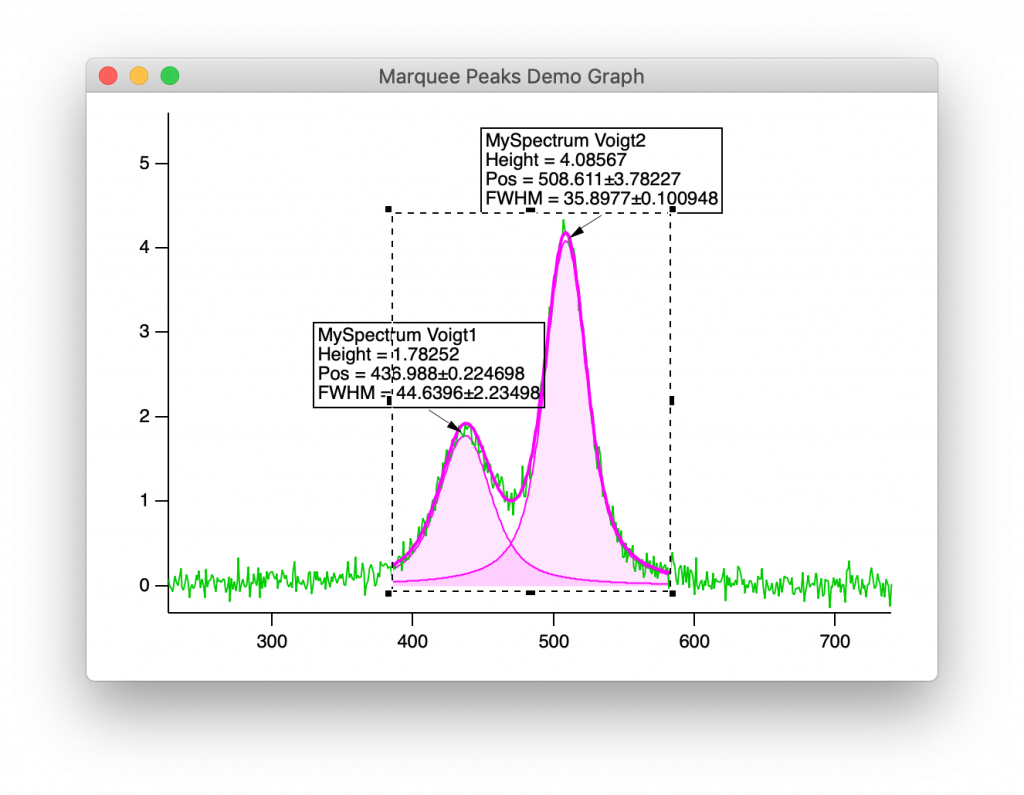
Doublet Peak: Attempts to fit a pair of peaks to a doublet and derives peak position, height, FWHM, and area parameters. Works best if the peaks are positioned at 1/4 and 3/4 of the selected x-range. Selects the best fit from attempts to fit a pair of Lorentzian, Gaussian and Voigt peaks.
Includes options to do all-in-one determinations for all of the traces on the plot. The results of all-in-one calculation are presented in a table. The waves displayed in the table are located in the package folder. It's up to the user to copy data into a more useful location.
This package also has some functions for normalizing spectra by peak height, peak area or total area. To normalize by total area or wavemax, use the trace and all traces menus (right click or shift-right click on a trace). The normalizing value can be changed in the settings window.
Settings can be configured thorough the Analysis - Marquee Peaks Settings... menu. Marquee Peaks Settings... also appears in the marquee menu. The traces and tags that Marquee Peaks adds to a graph window are removed either on the next mouseup, or when another Marquee Peak operation is selected, depending on the option selected.
Note: for Voigt fits, the approximate peak FWHM is used as a fit coefficient. The data are fit using the accurate VoigtPeak function. This method allows some kind of uncertainty for peak FWHM to be derived from curve fitting.
Project Details
Current Project Release
Marquee Peaks IGOR.8.00.x-2.21
| Release File: | Marquee Peaks221.zip (14.39 KB) |
| Version: | IGOR.8.00.x-2.21 |
| Version Date: | |
| Version Major: | 2 |
| Version Patch Level: | 21 |
| OS Compatibility: | Windows Mac-Intel |
| Release Notes: |
Preferences include setting for lineshape for peak fits. Choose between Gaussian, Lorentzian, Voigt, and Best Fit (previously best fit was always used). |

Forum

Support

Gallery
Igor Pro 10
Learn More
Igor XOP Toolkit
Learn More
Igor NIDAQ Tools MX
Learn More
I found one bug: The "Normalize By Total Area" and "Normalize By Wave Maximum" calls in the TracePopup menu are broken, since the called functions want at least a name as input. I guess the original intention was to use a wrapper function here. Also, it seems the TracePopup menu entries appear even for image plots, which may lead to problems if calls are not handled separately for images and traces (easy to do in a wrapper function).
February 19, 2021 at 11:21 pm - Permalink
Thanks for letting me know! Hopefully fixed for version 1.5.
February 20, 2021 at 01:50 am - Permalink
Tony, unfortunately this version already summons the debugger upon start because TraceInfo is called for building the menus without a graph open yet. This works better:
But I would think the two items could also be useful for images. Instead of blocking the menu here it might be an useful option to branch into ImageToWaveRef and TraceToWaveRef inside the normalization functions to handle both (and just quit for box/violin plots).
EDIT: The code also needed checks for strlen.
February 20, 2021 at 02:47 am - Permalink
Oops! Dynamic menus can be treacherous.
Thanks for the fix!
February 20, 2021 at 04:04 am - Permalink
Tony, I am sorry, but it still didn't work out. This function is called (twice) on every menu command after all, and the info from GetLastUserMenuInfo gets stale real quick (e.g., by closing the graph and then opening some other menu). Here is the (hopefully ultimate) solution to just build the menu when a trace on the top graph is selected:
At this point I'd probably have given up on dynamic menus and instead handled the different types of plots inside the normalization functions. ;)
By the way, some other details to note:
February 22, 2021 at 03:09 am - Permalink
Thanks for these good suggestions.
For the dynamic menus, I have used code like this before. Is there a way that this fails?
February 22, 2021 at 03:26 am - Permalink
Yes, you can crash this easily, unfortunately:
The result is that GetLastUserMenuInfo still refers to the now-closed old graph and the function drops the ball.
February 22, 2021 at 03:48 am - Permalink
In reply to Yes, you can crash this… by chozo
Hmm, that doesn't throw a run-time error for me. If I set a breakpoint I see the graph-does-not-exist error, but would never have noticed without Igor complaining about a run-time error. I've used code like this for a long time without noticing any problem. Do you definitely see a run-time error?
February 22, 2021 at 06:01 am - Permalink
In reply to Hmm, that doesn't throw a… by tony
OK, I see the problem, TraceInfo is unhappy about nonexistent graph.
This should do it.
February 22, 2021 at 06:14 am - Permalink
Hi Tony, nice! This will work. Apparently, TraceInfo() does not complain when getting fed a non-existing trace in an existing graph (this can happen, for example when a trace is removed from a graph). But be aware that this builds on some sketchy behavior of several functions: If the trace does not exist then NumberByKey will give NaN which makes SelectString spit out an empty string regardless of the options. In this case, that is what you want. ;)
February 22, 2021 at 06:28 am - Permalink
In reply to Hi Tony, nice! This will… by chozo
Yeah, I had checked what NumberByString does. It doesn't matter matter what string the function returns unless it is the menu of interest that is being built, and in that case both s_graphname and s_tracename will be valid.
February 22, 2021 at 06:38 am - Permalink
Hi Tony! I am new to Igor (ver. 9.03) and I want to use this tool to look at things like FWHM, peak position, etc for my XPS data. Do you happen to have a manual on how to install this tool and how to work it? Thank you!
April 26, 2024 at 12:34 pm - Permalink
How to install:
As it happens, I have put some effort into creating an easy way for users to install and maintain user projects.
First you need to install one of my other projects, the "updater" project. If you follow the link you should find instructions for installation. Once you have done that, you should have an easy-to-use user interface for installing other projects, including this one. Another project that I recommend is the "Procedure Loader", which makes it easy to load and unload user projects that you have installed.
As for instructions for this project, you first plot your data in a graph window, then draw a marquee around a region of interest and right click within the marquee to find some menu options. That's it!
April 29, 2024 at 02:00 am - Permalink