Display rows/cols of a labelled 2D wave against each other
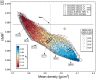
If you like to store data in labelled 2D, rather than in multiple 1D waves, this snippet might be useful.
Simply use the dimlabels to display specific rows or columns against each other, either display or append to top graph.
function mPlot(wave w, string yL, string xL, int dim [, int a])
	// displays rows or columns from a 2D wave w, depending on dim (0 or 1), as x-y plot
	// x and y are defined by dimension labels and passed as strings yL and xL
	// optional variable a: if specified as non-zero integer, data will be added to top graph
	// a=0 is the same as omitting a

	if (FindDimlabel(w,dim,yL) == -2 || FindDimLabel(w,dim,xL) == -2)
		print "DimLabel(s) not found"
		return -2
	endif

	// make sure a(ppend) is assigned
	a = !ParamIsDefault(a) && a !=0 ? 1 : 0

	if(a==0)
		if(dim==0)
			Display/W=(483,45,1125,561) w[%$yL][] vs w[%$xL][]
		else
			Display/W=(483,45,1125,561) w[][%$yL] vs w[][%$xL]
		endif

		// do some preferred graph formatting and set axes labels
		ModifyGraph tick=2,mirror=1,minor=1,btLen=4,stLen=2
		ModifyGraph margin(left)=70,margin(bottom)=70
		Label Bottom "\\Z22"+xL
		Label left "\\Z22"+yL
		SetAxis/A/N=1
		Legend/C/N=text1/S=3/A=MC
	else
		if(dim==0)
			AppendToGraph w[%$yL][] vs w[%$xL][]
		else
			AppendToGraph w[][%$yL] vs w[][%$xL]
		endif
	endif

	return 1
end

Forum

Support

Gallery
Igor Pro 10
Learn More
Igor XOP Toolkit
Learn More
Igor NIDAQ Tools MX
Learn More
Hmm, makes me think that an option for '2-D columns by dim label' could be added to the XY browser project... I don't have any immediate use for such a feature, but if someone is interested they should let me know.
February 2, 2024 at 05:40 am - Permalink
You can enter dimension labels as subranges in the New Graph dialog. If you use the more complex mode (click the More Choices button to display the holding list below the wave lists) you can Add a trace to the holding list, then pop up the menu on the desired dimension and you will get a menu of dimension labels.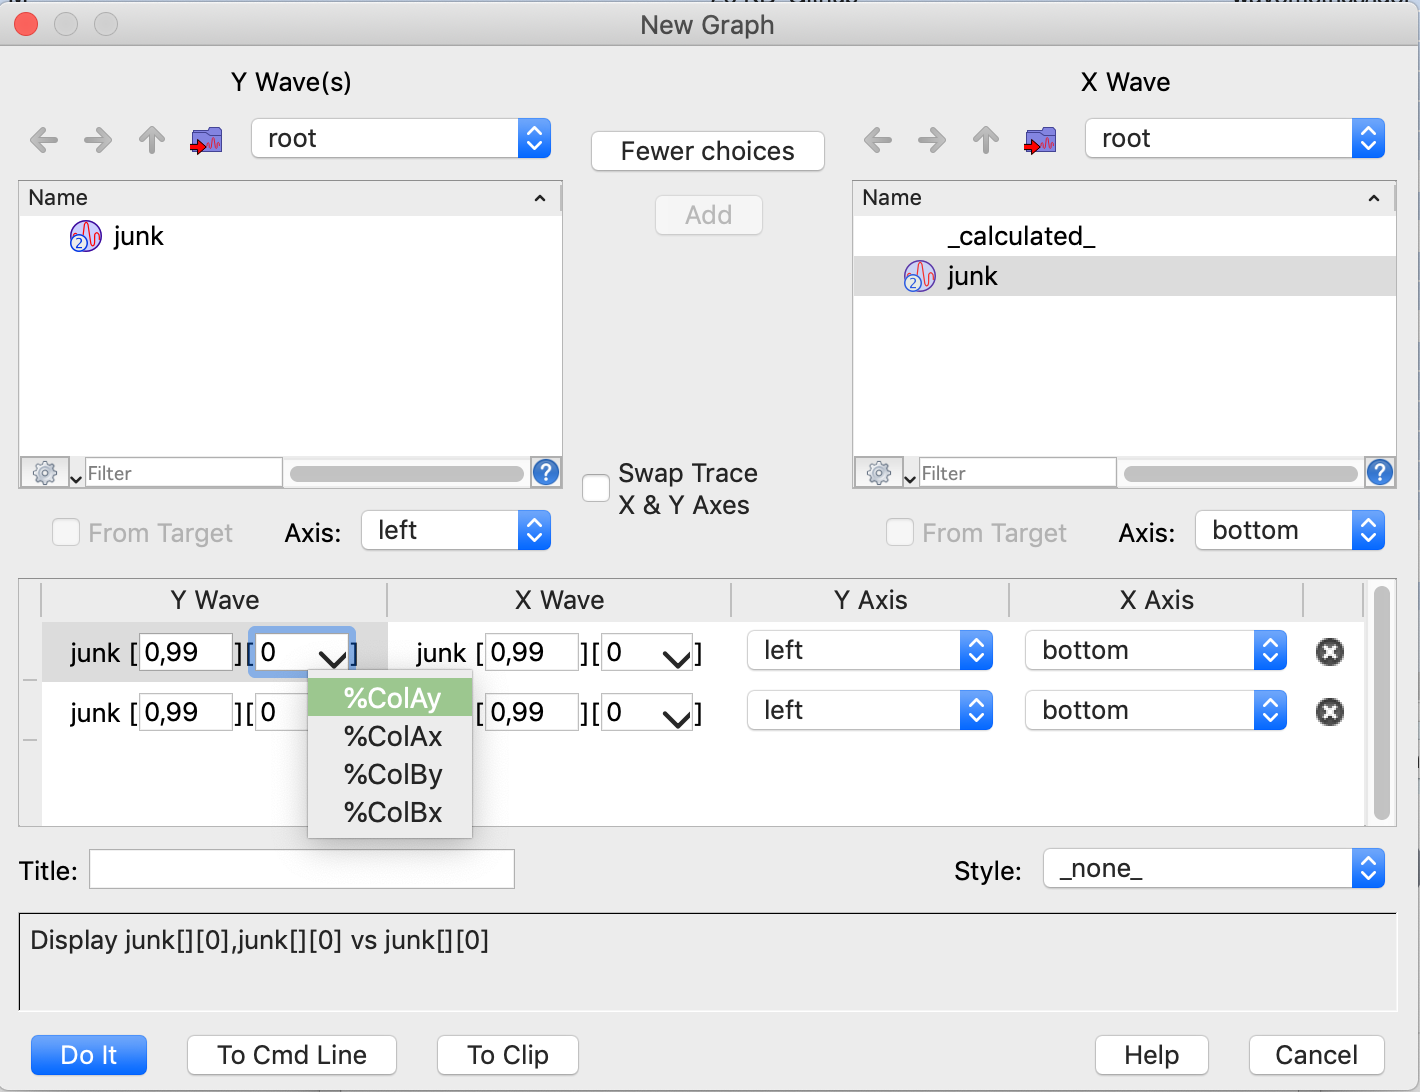
February 2, 2024 at 10:37 am - Permalink
John, I should have said that the snippet is meant as a shortcut to the above, I just need fewer characters on the command line ;-)
February 5, 2024 at 12:50 am - Permalink