Modify appearance of wave during "edit wave"


Hello
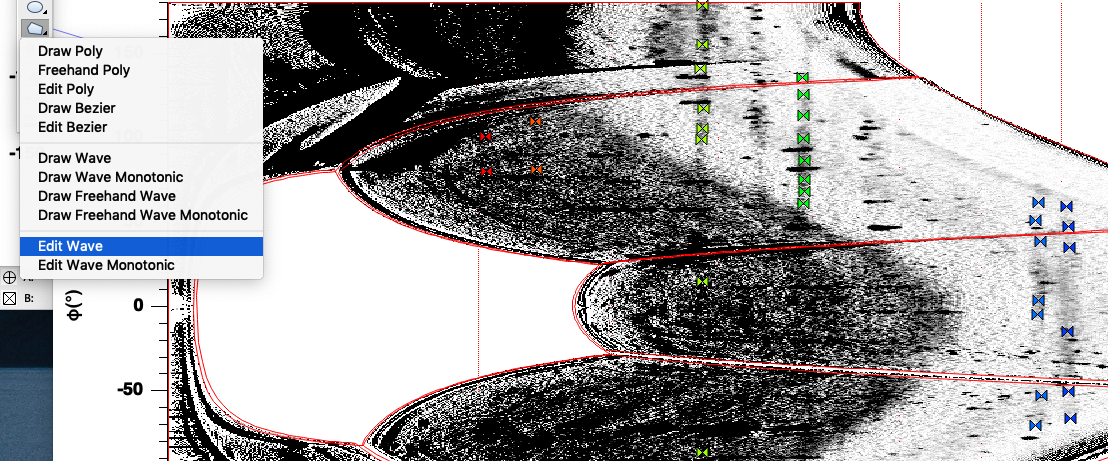
When using the graph tools (Cmd+T) and selecting Edit Wave, its appearance changes to Line+Markers
.
In some cases, the markers are hard to see and it would be a great to be able to adjust the marker size. Is this possible ?
No, I'm afraid not. This is one of those things where it is probably impossible for us to come up with a good solution for every possible situation.
An experiment suggests that the trace color is preserved in the edit wave mode. Can you change the color to something that shows up better? Or perhaps change the color of that cloudy background? Or have I misunderstood what you want?
April 15, 2020 at 10:33 am - Permalink
Hi John
I believe you understood my question correctly.
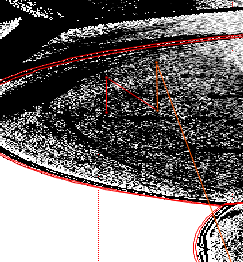
Indeed, we do change the color of the line to make it more visible, but in some cases (as the example I show here), we really have to squint to see the points that constitute the wave we are trying to edit.
I was just curious whether that was possible or not :-)
Perhaps we could write a special "edit_wave_function" that preserves the marker size/type ?
April 17, 2020 at 09:47 am - Permalink
I take it that the markers are too small?
April 17, 2020 at 10:28 am - Permalink
A trick that works for me is expanding the ROI (marquee selection followed by expand) on the region of interest and then the size of the markers may be easier to see.
AG
April 17, 2020 at 10:28 am - Permalink
Yes, in many cases i wish the markers would be bigger (ideally something we could set ) to make them more visible.
April 17, 2020 at 10:29 am - Permalink
In reply to A trick that works for me is… by Igor
millot1That's true but sometimes not practical as we are trying to pin the waves onto some faint features on the images, for which we need to have a more global view.
April 17, 2020 at 10:31 am - Permalink
It seems to me that you may benefit from modifying the display to include the main image (for the global view) and a hook function that updates a display in a second window to a magnified view of a small region around the cursor. I assume here that you will implement the editing in the magnified view. A similar concept is implemented in IP8 Image Menu->Particle Analysis.
April 17, 2020 at 10:43 am - Permalink
In reply to It seems to me that you may… by Igor
millot1Thanks for the suggestion. I will have a look!
Any chance to force EditWave to maintain the marker size ?
April 17, 2020 at 11:00 am - Permalink
Probably not in IP8.
April 17, 2020 at 11:03 am - Permalink
This sounds like one of those things where it's hard to do the right thing in all cases. If we displayed the edit view with your choice of marker and marker size, then I bet a lot of folks would complain that there are too many markers or that they overlap because they are too big. Of course, they could just change the marker temporarily. That, then, begs for a setting of some kind. I'm reluctant to add yet another setting for a feature that is rarely used.
April 17, 2020 at 11:07 am - Permalink
In reply to This sounds like one of… by johnweeks
millot1I understand.
we use and love this feature quite a bit!
April 17, 2020 at 11:20 am - Permalink
I'll look into it. It would have to be for Igor 9 at the earliest.
April 17, 2020 at 03:45 pm - Permalink
Great!
April 17, 2020 at 03:49 pm - Permalink
In reply to Hi John I believe you… by millot1
tonyHow about plotting the wave twice? Set the markers as you please for the first trace, and edit the second, overlying trace.
April 18, 2020 at 05:48 am - Permalink
In reply to Hi John I believe you… by millot1
tonyHow about plotting the wave twice? Set the markers as you please for the first trace, and edit the second, overlying trace.
April 18, 2020 at 05:53 am - Permalink
In reply to This sounds like one of… by johnweeks
tonyA feature that is very useful here.
April 18, 2020 at 05:56 am - Permalink
In reply to How about plotting the wave… by tony
millot1Thank Tony
That looks like a good trick.
April 18, 2020 at 09:27 am - Permalink
I have found that I can enter GraphWaveDraw mode with a specific type of marker using this sequence of commands:
Unfortunately, when I double-click to exit, the line goes back to the default for GraphWaveEdit. I can recover my desired markers for the wave edit only after I execute the GraphNormal command. Perhaps a new flag is needed?
I see that GraphWaveEdit has a /T flag, ostensibly to respect the marker settings.
So, one approach to fix this would be to write your own function that would enter graphwavedraw mode and preset your desired marker to use during the drawing process. Afterward, you can enter graphwaveedit mode and supposedly have those marker settings respected.
April 19, 2020 at 06:43 am - Permalink
I'll post after myself here.
I tried to create a programming way to accomplish the objective -- draw a wave edit (on an image) and keep the marker styles. My first stumbling blocks were that, immediately after the draw mode, the default exit goes to wave edit AND the marker reverts to the default for edit. I tried to program around this with a window hook and userdata field on the window. I found that I could not capture the double-click or "end of wave draw" event anywhere in the window hook.
I suggest that, rather than going through the drawing tools panel to a graph or image, this should be something to allow users to do with coding. But, to be effective, it needs these features:
I think that we also need a "semaphore flag" to indicate when the drawing mode has ended. Why? Imagine this sequence where the graph window has a hook to check userdata(drawmode).
* Click a button to enable drawing mode with immediate exit to normal mode
--> GraphWaveDraw ...
--> ModifyGraph mode=3,marker=8,msize=5,mrkThick=2
--> SetWindow userdata(drawmode)="active"
--> Button buttondraw userdata="draw", title="Exit"
* User draws the wave
--> Hook function checks mouse-up, determines that draw mode is active, and exits
* User end drawing (double click or connect-to-first-point)
--> Hook function DOES NOT KNOW that drawing mode has ended
* User MUST now ALSO click the "Exit" button
--> SetWindow userdata(drawmode)=""
--> Button buttondraw userdata="draw", title="Start"
When we would have a way to test the state of the graph, this would happen instead as ...
* Click a button to enable drawing mode with immediate exit to normal mode
--> GraphWaveDraw ...
--> ModifyGraph mode=3,marker=8,msize=5,mrkThick=2
--> SetWindow userdata(drawmode)="active"
--> Button buttondraw userdata="draw", disable=2
* User draws the wave
--> Hook function checks semaphore -- not set
--> Hook function checks mouse-up, determines that draw mode is active, and exits
* User end drawing (double click or connect-to-first-point)
--> Hook function checks semaphore -- SET
--> SetWindow userdata(drawmode)=""
--> Button buttondraw userdata="clear", title="Clear", disable=0
Finally, if the semaphore already would exist to say that drawing mode is not active, we could hack a bypass to the need for the other two flags on GraphWaveDraw.
* Click a button to enable drawing mode with immediate exit to normal mode
--> GraphWaveDraw ...
--> ModifyGraph mode=3,marker=8,msize=5,mrkThick=2
--> SetWindow userdata(drawmode)="active"
--> Button buttondraw userdata="draw", disable=2
* User draws the wave
--> Hook function checks semaphore -- not set
--> Hook function checks mouse-up, determines that draw mode is active, and exits
* User end drawing (double click or connect-to-first-point)
--> Hook function checks semaphore -- SET
--> GraphNormal/W=... // jump into normal mode to recover desired markers
--> SetWindow userdata(drawmode)="edit"
--> ModifyGraph mode=3,marker=8,msize=5,mrkThick=2
--> GraphWaveEdit/T=1 ... // jump back to edit mode with recovered markers
As a background to my interest, I want to get away from using the Marquee as the most effective way to draw regions on an image. I have avoided the drawing tools because I did not want to toggle the ShowTools on/off. It seems that, when I use the GraphWaveDraw mode as a substitute for the Marquee, I have to require addition steps (Start + Exit buttons), I am caught having a state that switches to markers that are the default for GraphWaveEdit, and I cannot program any way around these defaults.
April 19, 2020 at 08:38 am - Permalink
In reply to Hi John I believe you… by millot1
tonyGraphWaveEdit /T=1, executed from commandline or within a function, does preserve the marker size/shape. You get no change of style to indicate which wave is being edited, but you can have whatever you want for markers.
I tried this:
Curiously, "Special Edit" from the trace popup menu (right click on trace) doesn't work - the edit starts and immediately stops. I guess when the menu is done it acts like a double-click or something. But a workaround with execute /P does work.
Choosing Special Edit from the macros menu allows you to click on any trace and edit without modifying the trace appearance.
April 20, 2020 at 01:03 am - Permalink
Man, I learn stuff every day from these forums!
Neat trick, Tony, plotting the wave twice. I should have thought of that, we often use the plot-it-again trick to solve all kinds of problems.
And I wasn't even aware of GraphWaveEdit/T=1!
You have to be careful with your menu items, Tony. You have to show the drawing tools to get back out of GraphWaveEdit!
April 20, 2020 at 11:03 am - Permalink
In reply to Man, I learn stuff every day… by johnweeks
tonyI didn't worry about drawing tools because you can show and hide tools even in edit mode.
Edited previous post to add showtools.
April 21, 2020 at 12:34 am - Permalink
In reply to I didn't worry about drawing… by tony
johnweeksIt's true, you can. I discovered that while trying out your code. It took me a bit to realize that, and I'm not sure very many folks would figure it out. And I realize that you were contributing a simple example and not a finished product!
The whole GraphWaveEdit thing is kind of kludgy, but as you said, useful. I used it in the Select Points for Mask package (see the Packages menu in the Graph menu). For that package I put a button in the panel that gets you back out of GraphWaveEdit mode.
April 21, 2020 at 10:54 am - Permalink
I have just posted a panel control method to accomplish the desired behavior. The code would benefit by having
* /T flag on GraphWaveDraw (so that ending the wave draw retains the selected marker style)
* /X flag on GraphWaveDraw (to exit immediately to GraphNormal mode without the need to click an "End..." button)
* a way to catch when the user has ending the GraphWaveDraw mode (to manage automation more effectively)
April 23, 2020 at 09:34 am - Permalink
In reply to I have just posted a panel… by jjweimer
johnweeksI just tried out your panel. Some tricky stuff there!
On my Macintosh, the created trace did retain the style. Or am I missing something?
I guess so that you can double-click to end? Instead of going into edit mode?
April 23, 2020 at 10:37 am - Permalink
What I mean is ...
/TR=0,1 -- set trace mode at direct edit: jump directly to the default regardless of the pre-set mode (0) or retain the trace mode (1) when the drawing exits
(The GraphWaveDraw/T flag sets the trace to use the TOP axis, so the flag here would have to be different -- /TR)
==> The problem now that the trace returns to the DEFAULT (small makers, thin red line) when the drawing mode ends and the edit mode is immediately entered (e.g. after a double-click). So, this new flag is not to define the trace mode when the trace is created (that part works). The new flag is instead to RETAIN the preset trace mode when the draw mode ends.
/X=0,1 -- how to exit the draw mode: exit directly to EDIT mode (0 - default) or exit directly to normal mode (1)
==> The problem now is that double-clicking ends DRAWING mode directly to EDIT mode. In some cases, the desired approach may be to exit directly to normal mode. By example, choose one point on the image, double-click to directly exit to normal mode, and then run an analysis.
April 23, 2020 at 11:45 am - Permalink
Also, it seems that GraphWaveDraw creates the waves in the root: folder. I am unable to reference the waves in a different folder.
April 23, 2020 at 01:07 pm - Permalink
The waves are created in the current datafolder.
April 23, 2020 at 03:00 pm - Permalink
@John: Thanks. I'll work with this accordingly.
April 24, 2020 at 08:47 am - Permalink