Spidergram

Import geochemical datasets from databases or from mass spectrometer output files, reorder and normalize to produce geochemical spider diagrams.
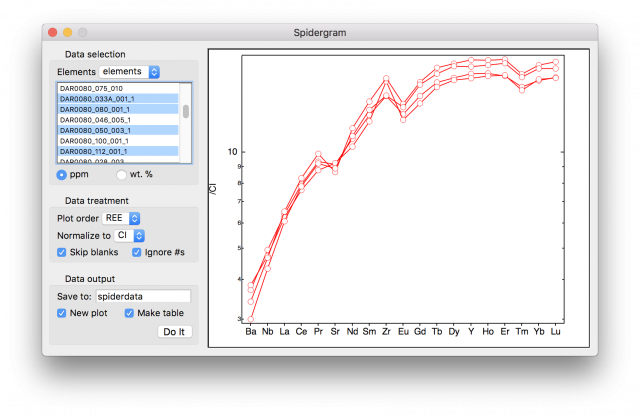
A spider diagram (spidergram) in geochemistry is a category plot of element concentrations. Typically whole-rock compositions are normalized by dividing by corresponding element concentrations in some parental composition; basaltic oceanic crust might be normalized to CI chondrite meteorites, for instance. This normalization removes the Oddo-Harkins 'odd-even' effect on element abundances arising from nucleosynthetic processes. The elements are usually ordered according to their 'compatibility', i.e. in order of their enrichment in the rock type relative to its source. Anomalous patterns can then be used to fingerprint specific processes of interest.
To create the plot thus requires reordering and looking up of reference data for normalization. This package aims to facilitate that part of the process. The aim is to output normalized data in the correct order for plotting, with the option of making a template spidergram plot that can be tweaked into the desired style of plot.
How to use
- Select "spidergram" from Macros menu.
- Easily import data by copying from a spreadsheet and pasting into the data selection listbox in the spidergram panel.
- Select data waves, element order and normalizing scheme in the data selection and data treatment areas of the panel to preview output.
- Click 'Do it' to save the reordered and normalized data in a subfolder.
If you'd like to test the package but don't have any geochemical data to hand, visit the PetDB database at http://www.earthchem.org/petdb. I used the MORB and mantle xenolith compilations for testing. Note that if you select many hundreds of analyses from one of these large data compilations it make take some time to import the data and to display large numbers of traces.
Select a 'custom' plot order and then click 'edit' if you want to define your own ordering scheme for elements.
Note: If you try to edit the appearance of the plot embedded in the panel, your changes will be lost when you create an output graph. Click 'Do It' first, then edit the newly created graph window as you please.
Limitations
Units for all data must be the same - i.e. can't mix ppm and wt.%.
Entries on the line (or column) containing categories (elements) cannot be interpreted if they contain ambiguous text or incorrectly capitalized symbols (though the package is tolerant of mixed numerals and text, e.g. "57Fe", such as you might find in text files exported from a mass spectrometer).
Compatibility
Not tested with Igor 6. You might get it to work, but you're on your own for importing data (try pasting into a table window).
Installing this package
- The IgorExchange Installer can be used to install Spidergram.ipf in the User Procedures folder.
- The Procedure Loader can be used to load or unload files stored in the User Procedures folder.
Images:

Project Details
Current Project Release
Spidergram IGOR.7.00.x-1.40
| Release File: | Spidergram140.zip (14.75 KB) |
| Version: | IGOR.7.00.x-1.40 |
| Version Date: | |
| Version Major: | 1 |
| Version Patch Level: | 4 |
| OS Compatibility: | Windows Mac-Intel |
| Release Notes: |
Adds normalizing data for Earth's primitive mantle from Lyubetskaya and Korenaga (2007) |

Forum

Support

Gallery
Igor Pro 10
Learn More
Igor XOP Toolkit
Learn More
Igor NIDAQ Tools MX
Learn More