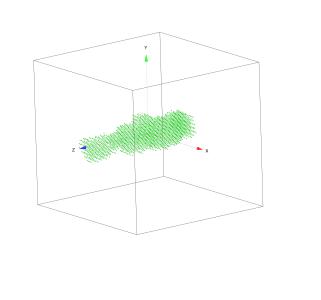
Read PDB files and display in Gizmo
This code will load PDB files as described here:
https://en.wikipedia.org/wiki/Protein_Data_Bank_(file_format)
and display them in Gizmo. There are many software packages able to display PDB files, but most are large and bit challenge to use. This code snippet will import PDB file, extract atom positions and display them in Gizmo.
//This set of procedures will read PDB (protein database) files:
//          https://en.wikipedia.org/wiki/Protein_Data_Bank_(file_format)
//
//Jan Ilavsky, 2018
//free to use or modify, no copyright.
//      Major thanks to John Weeks who wrote most of early code when I needed it
//      Thanks to tcaus, Igor Exchange user who described the pdb file structure:
//      referecne: https://www.wavemetrics.com/forum/general/igor-does-not-recognize-decimal-numbers-my-data
//To use:
// run ReadPDBFile()    in command line.


Function ReadPDBFile()
    //      the following pdb description is from Igor user group user icaus, original reference available here:
    //      https://www.wavemetrics.com/forum/general/igor-does-not-recognize-decimal-numbers-my-data
    //
    //  start in known place...
     String NewFoldername
     setDataFolder root:
    //this is definition of way PDB locations are written
    //note that most of data I do not need, you may need to change to code to read and use atoom names and other info.
    String columnInfo = ""                  // This only works for rows starting with "ATOM"
    columnInfo+="C=1,W=6,N=keyword;"    //"ATOM" name column                                 0
    columnInfo+="C=1,W=6,N='_skip_';"   // Atom number (last column unspecified)     7
    columnInfo+="C=1,W=5,N='_skip_';"   // Atom name; last character is "alt Loc"   13
    columnInfo+="C=1,W=3,N='_skip_';"   // Residue name; starts at column 18        18
    columnInfo+="C=1,W=2,N='_skip_';"   // Chain identifier in column 22 (21=?) 21
    columnInfo+="C=1,W=4,N='_skip_';"   // Residue sequence number                      23
    columnInfo+="C=1,W=4,N='_skip_';"   // Blank stuff                                      27
    columnInfo+="C=1,W=8,N=xval;"        // Should start at column 31               31
    columnInfo+="C=1,W=8,N=yval;"            //                                                 39
    columnInfo+="C=1,W=8,N=zval;"        //                                                 47
    columnInfo+="C=1,W=6,N='_skip_';"   // Occupancy
    columnInfo+="C=1,W=6,N='_skip_';"   // Temperature info
    columnInfo+="C=1,W=11,N='_skip_';"  // Element symbol   (col 77,78)
    columnInfo+="C=1,W=2,N='_skip_';"   // Charge (col 79,80)
    //OK, now load the data...
    LoadWave/A/O/F={14,8,0}/K=2/B=columnInfo
    Wave/T xval, yval, zval
    Wave/T keyword
    //create name for future data location, unique name created from loaded file name.
     NewFoldername= UniqueName(StringFromList(0,S_FileName,"."), 11, 0)
     //remove all non ATOM lines from the waves...
    Variable count=numpnts(keyword)-1
    do
        if (strsearch(keyword[count], "ATOM", 0) <0 )
            DeletePoints count, 1, keyword, xval, yval, zval
        endif
        count-=1
    while (count >= 0 )
    //create location for centers of atoms in Gizmo and assign the positions.
    Make/O/D/n=(numpnts(xval),3) centersWave=nan
     centersWave[][0]=str2num(xval[p])
     centersWave[][1]=str2num(yval[p])
     centersWave[][2]=str2num(zval[p])
    //cleanup
    KillWaves keyword, xval, yval, zval
     //create location for data
     NewDataFolder/S $(NewFoldername)
     //move there the centers wave
     MoveWave root:centersWave, $(GetDataFolder(1))
    //now create the Gizmo, it needs to know where the data are, this is one way to tell it...
    string PathToData=GetDataFolder(1)+"centersWave"
    MakeGizmo(PathToData)
End

Function MakeGizmo(PathToData)
    string PathToData
    //will create Gizmo, I used existiing Gizmo and created recreation function.
    //these are the centers...
    Wave GizmoData=$(PathToData)
    NewGizmo/K=1/W=(83,132,981,947)
    ModifyGizmo startRecMacro=700
    ModifyGizmo scalingMode=8
    ModifyGizmo scalingOption=0
    AppendToGizmo Scatter=GizmoData,name=scatter0
    ModifyGizmo ModifyObject=scatter0,objectType=scatter,property={ scatterColorType,0}
    ModifyGizmo ModifyObject=scatter0,objectType=scatter,property={ markerType,0}
    ModifyGizmo ModifyObject=scatter0,objectType=scatter,property={ sizeType,0}
    ModifyGizmo ModifyObject=scatter0,objectType=scatter,property={ rotationType,0}
    ModifyGizmo ModifyObject=scatter0,objectType=scatter,property={ Shape,1}
    ModifyGizmo ModifyObject=scatter0,objectType=scatter,property={ size,1}
    ModifyGizmo ModifyObject=scatter0,objectType=scatter,property={ color,4.57771e-05,0.8,1.5259e-05,1}
    AppendToGizmo Axes=boxAxes,name=axes0
    ModifyGizmo ModifyObject=axes0,objectType=Axes,property={-1,axisScalingMode,1}
    ModifyGizmo ModifyObject=axes0,objectType=Axes,property={-1,axisColor,0,0,0,1}
    ModifyGizmo modifyObject=axes0,objectType=Axes,property={-1,Clipped,0}
    AppendToGizmo attribute pointSize=8, name=pointSize0
    ModifyGizmo setDisplayList=0, attribute=pointSize0
    ModifyGizmo setDisplayList=1, object=scatter0
    ModifyGizmo setDisplayList=2, object=axes0
    ModifyGizmo currentGroupObject=""
    ShowTools
    ModifyGizmo showInfo
    ModifyGizmo infoWindow={904,365,1721,662}
    ModifyGizmo showAxisCue=1
    ModifyGizmo pan={0.075688,-0.110429}
    ModifyGizmo idleEventQuaternion={-1.1184e-06,6.7395e-06,-4.52601e-06,1}
    //these next two lines scale the Gizmo axes to be 5% larger than Max atom position value.
    //*1.05 should make sure the all positions are inside, not clipped, and x,y, and z have same scale
   //(so dimensions are not distorted).
    WaveStats/Q GizmoData
    ModifyGizmo setOuterBox={-1.05*V_max,1.05*V_max,-1.05*V_max,1.05*V_max,-1.05*V_max,1.05*V_max}
end


Forum

Support

Gallery
Igor Pro 10
Learn More
Igor XOP Toolkit
Learn More
Igor NIDAQ Tools MX
Learn More
