ピーク検出
取得したデータからピークを見つけることは、データのタイプによって異なる一種の芸術です。
ピーク検出を容易にするため、ベースライン(または「トレンド」)を除去することや、データを平滑化することが有効です。
正方向のみ、または負方向のみのピークが連続する場合:
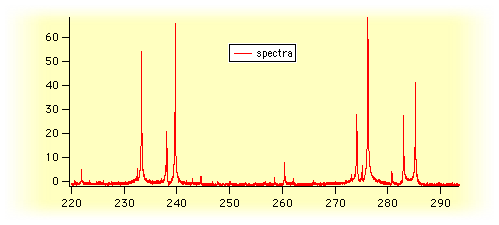
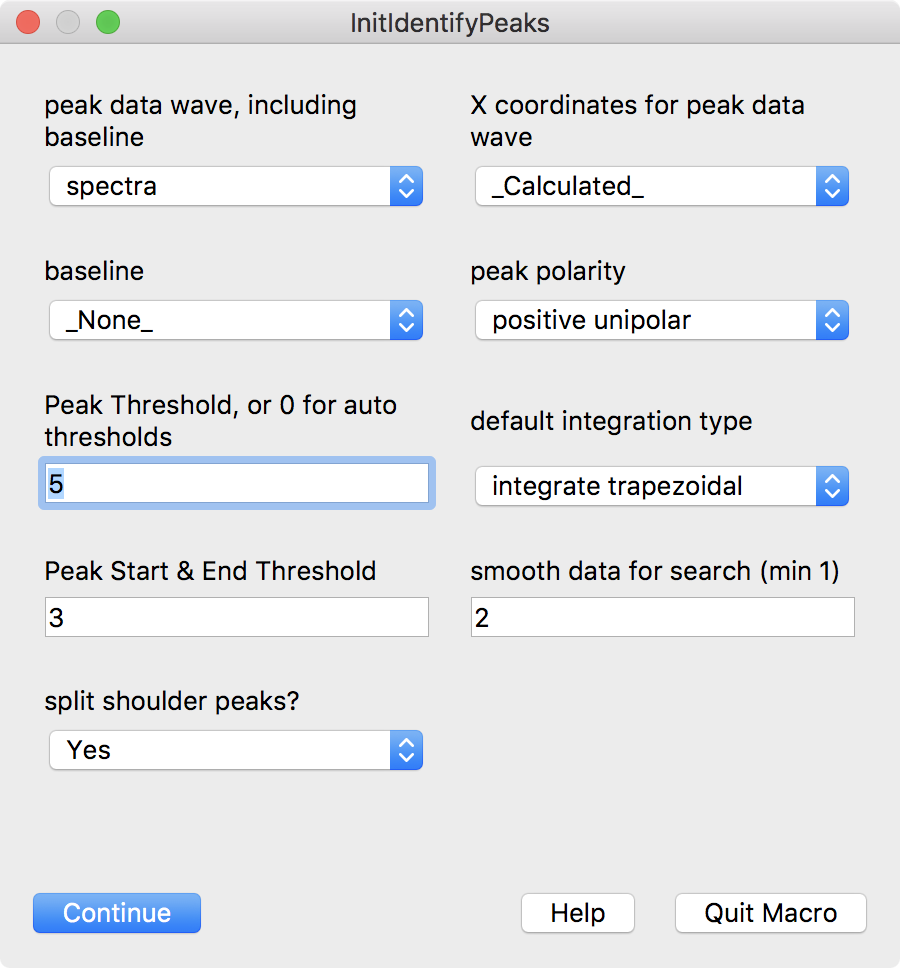
ピーク位置を自動的に特定するには、PeakAreasUnipolar.ipf プロシージャファイル(テクニカルノート #020-C Unipolar Peak Areas)を使用できます:
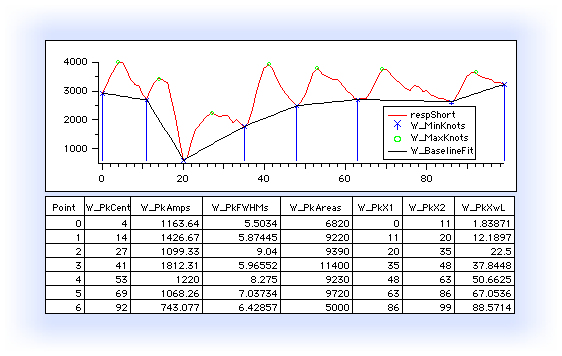
正負の値が交互に現れるピークに対して:
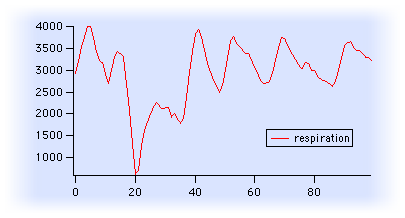
ピーク面積を自動検出、ベースライン構築、面積計算するには、Peak Areas.ipf プロシージャファイル(テクニカルノート #020-B Peak Areas の一部)を使用できます:
プログラミングに慣れているなら、Igor Pro の組み込み FindPeak コマンドをプロシージャ内で繰り返し使って、ピークの開始点と終了点を特定できます:
Wave w	// peak data
Make/O/N=(maxPeaks) peakPositionsX= NaN, peakPositionsY= NaN
Variable peaksFound=0
Variable startP=0
Variable endP= DimSize(w,0)-1
do
    FindPeak/B=(smoothing)/I/M=(threshold)/P/Q/R=[startP,endP] w
    // FindPeak outputs are V_Flag, V_PeakLoc, V_LeadingEdgeLoc,
    // V_TrailingEdgeLoc, V_PeakVal, and V_PeakWidth.
    if( V_Flag != 0 )
        break
    endif

    peakPositionsX[peaksFound]=pnt2x(w,V_PeakLoc)
    peakPositionsY[peaksFound]=V_PeakVal
    peaksFound += 1

    startP= V_TrailingEdgeLoc+1
while( peaksFound < maxPeaks )

if( peaksFound )
    Redimension/N=(peaksFound) peakPositionsX, peakPositionsY

    DoWindow/F ShowPeaks
    if(V_Flag == 0 )
        Display/N=ShowPeaks w
        AppendToGraph/W=ShowPeaks peakPositionsY vs peakPositionsX
        ModifyGraph/W=ShowPeaks mode(peakPositionsY)=3,marker(peakPositionsY)=19, rgb(peakPositionsY)=(0,0,65535)
    endif
else
    DoAlert 0, "No peaks found using threshold= "+num2str(threshold)
    KillWaves/Z peakPositionsX, peakPositionsY
endif
Multi-Peak Fitting パッケージは、Peak AutoFind.ipf プロシージャを使います。このプロシージャは FindLevel コマンドを用いて、データの平滑化された導関数を検索します。このプロシージャを使うには、次のように入力します:
#include <Peak AutoFind>
Procedure ウィンドウで、または Analysis→Packages サブメニューから Multi-peak Fitting 2 を選択します。ルーチンを表示するには、Igor Pro の Window→Procedure Windows メニューから Peak AutoFind.ipf プロシージャを選択し、ルーチンの使用方法の表示には Procedure Windows メニューから Multi-Peak Fitting 2.ipf を選択します。
以下は、Peak AutoFind プロシージャファイルを使う手順です:
#pragma rtglobals=1
#include <Peak AutoFind>
Menu "Analysis"
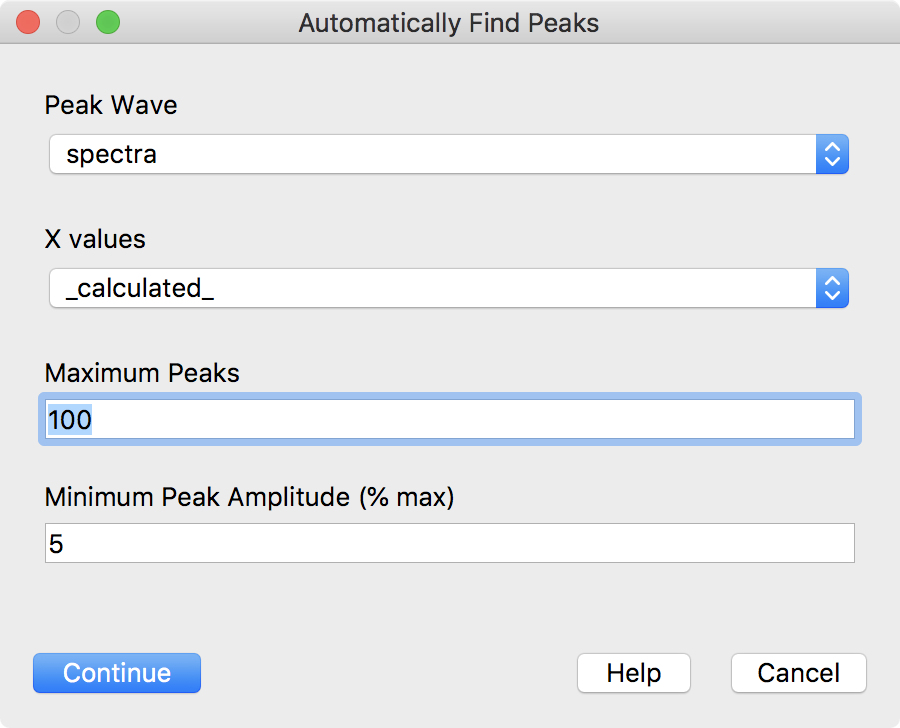
"Automatically Find Peaks", /Q, MyAutomaticallyFindPeaks()
EndMacro
Function MyAutomaticallyFindPeaks()
String wname, xdata="_calculated_"
Variable maxPeaks=100, minPeakPercent=5
Prompt wname, "Peak Wave", popup, WaveList("*",";","DIMS:1,TEXT:0,CMPLX:0")+"_none_;"
Prompt xdata, "X values", popup, "_calculated_;"+WaveList("*",";","DIMS:1,TEXT:0,CMPLX:0")
Prompt maxPeaks, "Maximum Peaks"
Prompt minPeakPercent, "Minimum Peak Amplitude (% max)"
DoPrompt "Automatically Find Peaks", wname, xdata, maxPeaks, minPeakPercent
if( V_Flag != 0 )
return 0 // user cancelled
endif
WAVE/Z w=$wname
WAVE/Z wx=$xdata
Variable pBegin=0, pEnd= numpnts(w)-1
Variable/C estimates= EstPeakNoiseAndSmfact(w,pBegin, pEnd)
Variable noiselevel=real(estimates)
Variable smoothingFactor=imag(estimates)
Variable peaksFound= AutoFindPeaks(w,pBegin,pEnd,noiseLevel,smoothingFactor,maxPeaks)
if( peaksFound > 0 )
WAVE W_AutoPeakInfo
// Remove too-small peaks
peaksFound= TrimAmpAutoPeakInfo(W_AutoPeakInfo,minPeakPercent/100)
if( peaksFound > 0 )
// Make waves to display in a graph
// The x values in W_AutoPeakInfo are still actually points, not X
Make/O/N=(peaksFound) WA_PeakCentersY = w[W_AutoPeakInfo[p][0]]
AdjustAutoPeakInfoForX(W_AutoPeakInfo,w,wx)
Make/O/N=(peaksFound) WA_PeakCentersX = W_AutoPeakInfo[p][0]
// Show W_AutoPeakInfo in a table, with dimension labels
SetDimLabel 1, 0, center, W_AutoPeakInfo
SetDimLabel 1, 1, width, W_AutoPeakInfo
SetDimLabel 1, 2, height, W_AutoPeakInfo
CheckDisplayed/A W_AutoPeakInfo
if( V_Flag == 0 )
Edit W_AutoPeakInfo.ld
endif
DoWindow ShowPeaks
if( V_Flag == 0 )
if( WaveExists(wx) )
Display/N=ShowPeaks w vs wx
else
Display/N=ShowPeaks w
endif
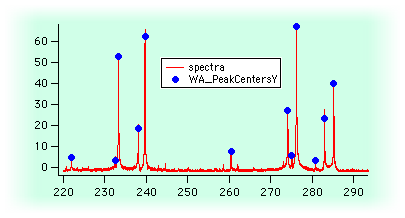
AppendToGraph/W=ShowPeaks WA_PeakCentersY vs WA_PeakCentersX
ModifyGraph/W=ShowPeaks rgb(WA_PeakCentersY)=(0,0,65535)
ModifyGraph/W=ShowPeaks mode(WA_PeakCentersY)=3
ModifyGraph/W=ShowPeaks marker(WA_PeakCentersY)=19
endif
endif
endif
if( peaksFound < 1 )
DoAlert 0, "No Peaks found!"
endif
return peaksFound
End
(このコードの近代化版が、Igor Pro® 8 の#include <Peak AutoFind> プロシージャファイルに追加されました。)
参照: レベル検出

Forum

Support

Gallery
Igor Pro 10
Learn More
Igor XOP Toolkit
Learn More
Igor NIDAQ Tools MX
Learn More