Logarithmic scale on slider


Hi,
I am working on a fitting software and at some point, I would like the user the set the mask of the fit manually with two sliders. My issue right now is that my waves must be displayed on a logarithmic scale and I haven't find any way so far to create a slider with a logarithmic scale.
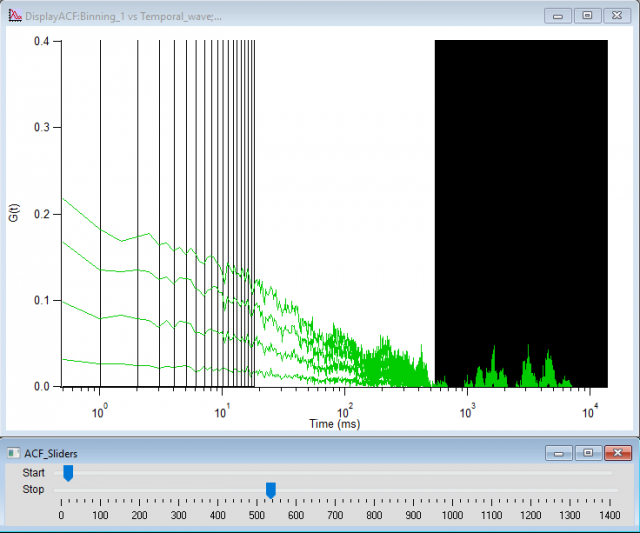
Here is a picture of what it looks like with un-matched scales. The green curve is the wave I need to fit and the black part represents the mask setting.
Does anyone know how to overcome this issues?
Regards,
Tom
I don't think that you can use a log scale on a slider, but you can set custom tick positions and labels (use userTicks={tvWave,tlblWave }) to achieve the same effect.
Have you considered getting user input in ways other than a slider? I find the graph marquee to be a more natural way to select regions for fitting. See my baseline fitting package for examples.
January 2, 2018 at 10:17 am - Permalink
Link to baseline fitting package http://www.igorexchange.com/project/Baselines
January 2, 2018 at 10:22 am - Permalink
Thank you for your quick answer! Actually my first idea was to use a graph mark method but I didn't how to do this. I will try it in a few days and give you some feedback.
Thanks!
Tom
January 3, 2018 at 03:18 am - Permalink
I tried your Baseline package but I stopped because I am using an user-defined function and I didn't know how to implement this in your macro. I thought it might not be a big trouble but I don't understand most of the code your are using and I don't have so much time to invest in this problem.
So I tried your first guest instead, meaning using a variable that is the log of my initial variable and it is working very fine! Here is a picture of how it looks like. The fact that the bottom axis is displayed in a log scale renders a different thickness of the slider limits depending on where they are positionned. I think this is kind of cool ; )
Thank you Tony for you help.
Here is some détails about the code I am using in case someone needs it:
// Sliders variables
variable/G ACFmaskin1Log=0
variable/G ACFmaskout1Log=log(dimsize(Ac_moyennes,0))
Variable ACFSliderLimit=log(dimsize(Ac_moyennes,0))
Variable ACFticksNb=log(dimsize(Ac_moyennes,0))
// Set the slider panel
Execute "ModifyPanel cbRGB=(56797,56797,56797)" // This darken the panel background because default one is very close to the sliders color
DrawText 60,18,"Start"
Slider ACFstart1,pos={105,2},size={597,20},limits={0,ACFSliderLimit,0.001},variable= ACFmaskin1Log,vert=0,live=1,ticks=0,value=0
Slider ACFstart1 proc=ACFSliderStart
DrawText 60,37,"Stop"
Slider ACFstop1,pos={105,22},size={597,20},limits={0,ACFSliderLimit,0.001},variable= ACFmaskout1Log,vert=0,live=1,ticks=ACFticksNb,value=ACFSliderLimit
Slider ACFstop1 proc=ACFSliderStop
DrawText 50,56,"(log ms)"
// Set the mask
Variable/G ACFmaskin1=floor(10^ACFmaskin1Log)
Variable/G ACFmaskout1=floor(10^ACFmaskout1Log)
make/O/N=(dimsize(Ac_moyennes,0)) ACFslidermaskGraph=NaN
ACFslidermaskGraph[ACFmaskin1]=inf
ACFslidermaskGraph[ACFmaskout1]=inf
// Display the mask in a filled cityscape mode.
Appendtograph ACFslidermaskGraph // display the mask on the trace graph
ModifyGraph mode(ACFslidermaskGraph)=5
ModifyGraph rgb(ACFslidermaskGraph)=(65535,65535,65535)
ModifyGraph hbFill(ACFslidermaskGraph)=2
// Each slider procedure contains a re-calculation of the mask and an updating of the graph
January 5, 2018 at 01:43 am - Permalink
--
J. J. Weimer
Chemistry / Chemical & Materials Engineering, UAH
January 5, 2018 at 01:34 pm - Permalink
What does your user-defined function look like - maybe you could post it here?
I'll try to post a new version of the baselines package that makes it easy to add a user-defined fitting function.
January 5, 2018 at 02:56 pm - Permalink
JJweimer: Yep, that's a good idea. I did quite a similar thing, I put two setvar commands on an other panel that do the same job. If I need to do a new version of the soft I might put it just next to the sliders as you did as it's more convenient.
Tony: I am using a model that describes the diffusion of a random walker on a 2D plane, viewed through a square detector (i.e. the pixel of an emCCD camera). I don't think this might be useful to a lot of people. Anyway, here is the formula, you can find it in its original article in Huang H, Simsek MF, Jin W, Pralle A (2015) Effect of Receptor Dimerization on Membrane Lipid Raft Structure Continuously Quantified on Single Cells by Camera Based Fluorescence Correlation Spectroscopy. PLoS ONE 10(3): e0121777. doi:10.1371/journal.pone.0121777
Bye,
Tom
January 6, 2018 at 05:38 am - Permalink