Construction of a master curve


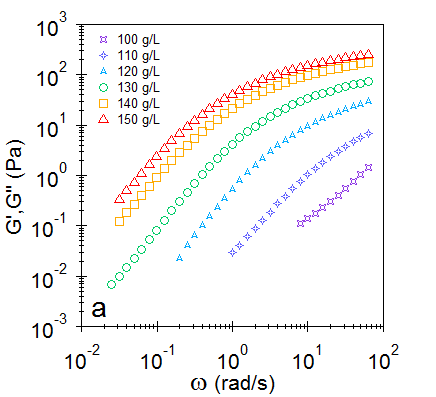
I have different curves presenting the shear modulus vs angular frequency of a polymer solution measured at different concentrations.
I would like to generate a master curve of the storage modulus vs angular frequency.
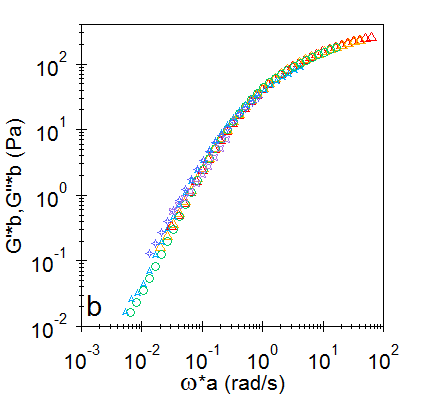
Basically, I need to determine the horizontal and vertical shifts in order to superpose all the curve and construct a master curve. I want to automatize the process, instead of shifting the data by hand.
GraphA shows the originlal curves for all concentrations. The aim is to superpose all curves on the red one which is the reference curve. GraphB shows the result when shifting the data by hand.
I want to determine the horizontal and vertical shifts for each concentrations minimizing the error using least square.
Does someone have any idea of an Igor script ?
Many thanks

A.G.
WaveMetrics, Inc.
May 13, 2016 at 01:53 pm - Permalink
AG is right that this would an optimization problem, and it might be solved using the Optimize operation. But to do that, you have to figure out what quantity to maximize or minimize. Saying "minimizing the error" is a bit ambiguous. Perhaps in the process of trying to describe to us what that means you will figure out what it means :)
The obvious thing would be minimizing the "distance" between the curves, but the short one on the right seems to have a large number of ways to overlay it on the long one on the left, while keeping some definition of "distance" nearly constant.
John Weeks
WaveMetrics, Inc.
support@wavemetrics.com
May 16, 2016 at 01:17 pm - Permalink
May 16, 2016 at 03:36 pm - Permalink
Thank you all for your answers.
My first idea for this optimization problem was to use my reference cruve as [x_0(i),y_0(i)]. For the curve [x_1(i),y_1(i)] I need to translate , I can create a rescale curve using two variables a and b to obtain [a*x_1(i),b*y_1(i)]. Then I can interpolate on the x_0(i) and obtain a new ensemble [x_0(i),y'_1(i)]. From this point i can create a number : c=Sum on all i (y'_1(i)-y_0(i))² and the final objectif is to choose a and b in order to minimize this sum.
I don't know if this explanation will help you understanding my problem.
May 17, 2016 at 04:34 am - Permalink
Are you sure you want multiplication? Think about the small trace on the far right- to move it over to the large trace on the far left (I presume that is your reference curve) you will wind up greatly contracting the X range of the trace on the right. Perhaps you meant to use subtraction?
Down-sampling the large curve on the left to match the number of points in the trace on the right might be appropriate. I suspect that this approach will result in basically centering the moving trace on top of the reference curve. Is centering what you want? That won't necessarily find the position where the slopes match best.
John Weeks
WaveMetrics, Inc.
support@wavemetrics.com
May 17, 2016 at 10:26 am - Permalink
But then I realized, I am still a novice at MatrixOP. :-)
--
J. J. Weimer
Chemistry / Chemical & Materials Engineering, UAH
May 17, 2016 at 01:53 pm - Permalink
Alas no MatrixOP in this problem.
I'm also not sure why you'd want to fit a 3 or 4 degree polynomial to this data. My own $0.02 is to run a number of line fits which give you two parameters each for computing the necessary shifts.
A.G.
May 17, 2016 at 03:24 pm - Permalink
I guess the polynomial was an "in my head" transformation of the straight lines on the log-log plot.
Would you suggest two log-log straight lines for each curve, one at the top-right slope and one at the left-bottom slope?
--
J. J. Weimer
Chemistry / Chemical & Materials Engineering, UAH
May 17, 2016 at 08:23 pm - Permalink
I'm not a big fan of log-log plots because they provide a convenience that also helps you forget that you are transforming the data. This application is a perfect example.
My own preference would be to transform the data first and then use StatsLinearRegression with /PAIR in order to account for the log in the x-direction.
A.G.
May 18, 2016 at 10:12 am - Permalink