How to make 2D density plot?
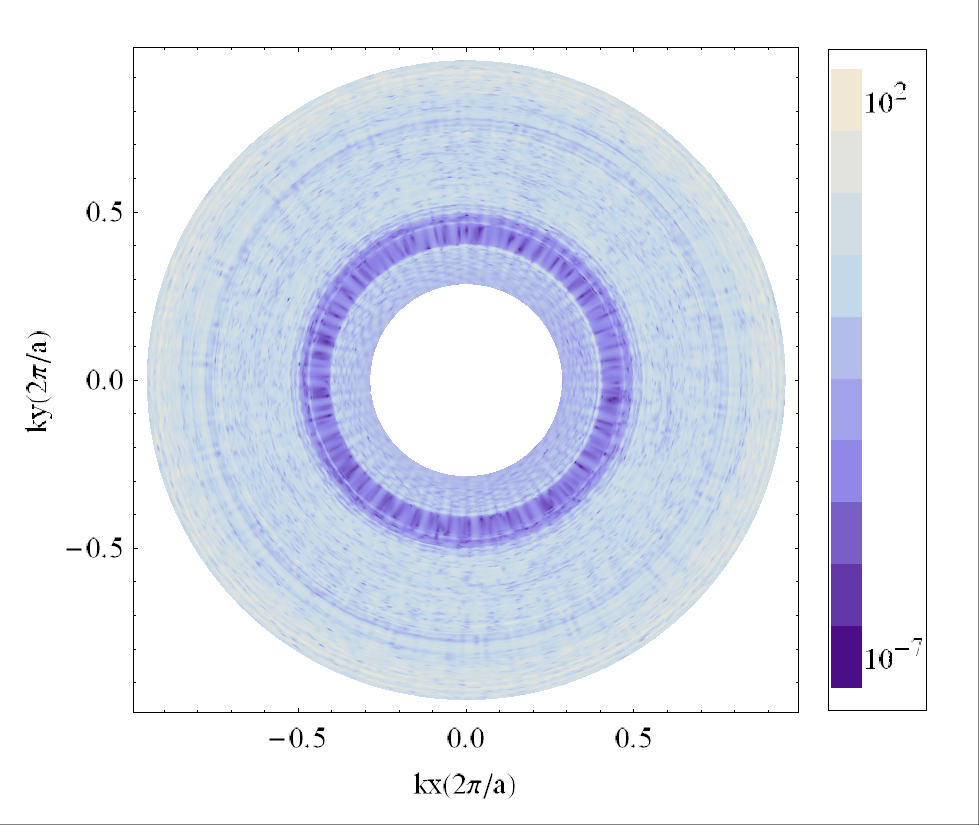
I have a 3-column matrix attached, and I am trying to make a density plot of it. The first column is the x coordinates, the second column is the y coordinates, and the third column is the corresponding intensity at (x,y). Since my intensity range is pretty large, it is better to make it in log10 scale.
I have also attached an desired graph I made from this data using Mathematica. Could you help me with making this kind of graph using Igor?
Thanks a lot.
phyllo-bs.txt
(1.79 MB)
bz.png
(416.56 KB)


It sounds like you need an imageplot, but that takes a 2D wave (matrix) of Z values, where the X and Y values are either given by the wave scaling, or by separate waves.
If your data is evenly spaced along the X and Y axis, you could reorder the data into a matrix. If it is unevenly spaced, you could interpolate with ImageInterpolate. Which works, but is a tad slow for large data sets.
Alternatively you could do a contour plot, which also takes data in you format of an XYZ-wave triplet.
January 23, 2013 at 05:55 am - Permalink
(1) using a Voronoi interpolation works OK, but to get a fine grid takes a lot of time. Also you will get a spurious level in the "doughnut hole" that you may want to remove (e.g. set to NaN)
(2) A Gizmo scatter plot will work, giving a z-axis view resembling a 2D image. You will have to play with the marker and size.
(3) A Gizmo parametric triangular surface will look best but is complicated to make.
(4) My recommendation for a fast and simple method:
Load the delimited text data as waves wx, wy, wz
Convert to log: wz=log(wz)
Make a graph and display wy vs wx as dots; use the Plan mode for equal x and y scaling.
Using the Modify Trace Appearance dialog, Set as f(z).. color from wz
Modify dot size and colorscale to suit your needs.
Note that your Mathematica display is also doing some form of smoothing or interpolation to achieve its blended appearance.
January 23, 2013 at 06:21 am - Permalink
Paste the following function in your procedure window:
and finally execute:
I hope this helps,
A.G.
WaveMetrics, Inc.
January 23, 2013 at 12:25 pm - Permalink