How to make box plot per-category colors?


Hi, I'm using Igor 8 (latest). I have a box plot with two categories. I'd like to color the plot per-category (ideally both the boxes and the data points). That doesn't seem to be an option in the Modify box plot menu, and I can't do a Customize at point either (it's grayed out). There's a dropdown in the Modify Box plot menu to select a trace, but despite having two categories I only have one trace in that menu.
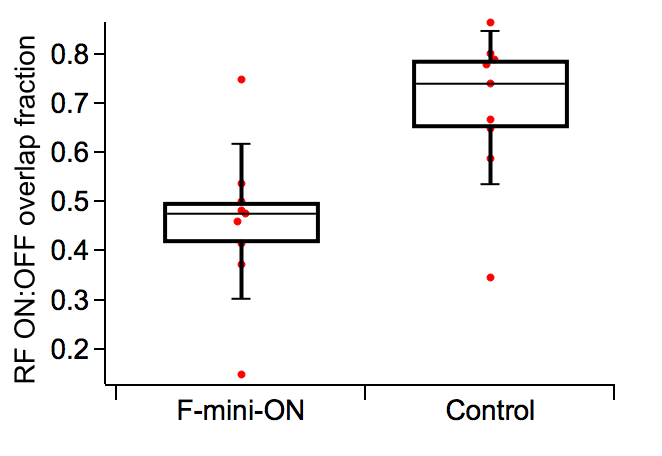
In the example image, I'd like the red dots on the left side to be a different color.
Is this possible?
There is a slightly hacky solution to this. Make two 2D waves (with two columns), one for each of your two groups. In the first, data goes in column 0, and column 1 is set to NaN. In the second, set column 0 to NaN and then data in column 1. Now use appendboxplot to plot the first wave vs your text wave and then again to plot the second in the same way. Now use ModifyGraph toMode=-1 so that the data columns are in the right place. Now you can modify the colours independently.
August 26, 2020 at 01:14 pm - Permalink
sjr51 has the present solution to this problem.
The future solution is Igor Pro 9, due to start beta testing soon.
August 26, 2020 at 02:16 pm - Permalink
Thanks to you both; I'll try this solution.
I'd love to try the beta when that's available, if that's an option.
August 26, 2020 at 05:52 pm - Permalink
The beta will be announced in the forums and on the mailing list, so just keep watching here.
August 27, 2020 at 09:54 am - Permalink