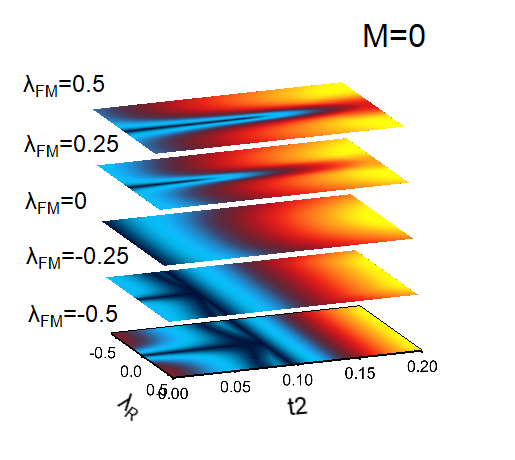
I have a Gizmo plot with stacking of five images. The image colorscale seems to be independent with each other. How to set global z range for Gizmo image plot?
I am guessing that you are using Gizmo Image objects and not Surface objects that are z-slices from some volumetric data. If that is the case, each Gizmo Image uses a completely independent range for its colorscale that only depends on the range of z-values in the image data.
One solution that I can think of is for you to create each one of the desired images as an RGB image that has the appropriate colorscale range and then create Gizmo Image objects from the RGB images. You can create RGB images by displaying the image, modifying its colorscale range saving to disk and then reloading. You can also do so programmatically. Here is an example:
The Gizmo recreation macro is:
I hope this helps,
AG
January 16, 2026 at 12:39 pm - Permalink
Thank you for your help!
February 10, 2026 at 12:46 am - Permalink