

New Annotation Category - Group Labels



I would like to propose the addition of a new type of annotation for plots - Group Labels.
As I am promoting Igor pro within my team, one of the holdups others have in using Igor more is the lack of this feature since it exists to some extent or another in competitor software.
For example, if I make a plot in Igor, I often put it into PowerPoint to add some labels to some subset of my data - it would be great to be able to do this natively in Igor.
A few examples:
- Enclose a contiguous group of data (options for oval, or rectangle) with optional fill, optional text description, and optionally cover the axis label as well
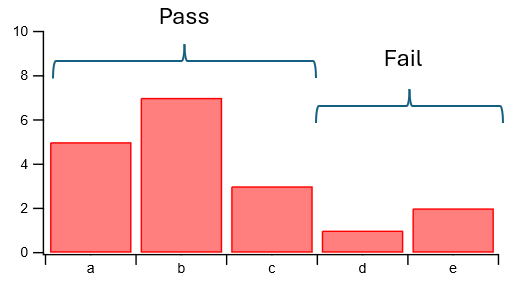
- Add curly braces spanning a certain x, or y range - with optional text labels, tie the x or y position to plot axis as an option
- Add a text box to span a range of x or y data - options for fill, option to lock to x,y graph axis
- There are probably more
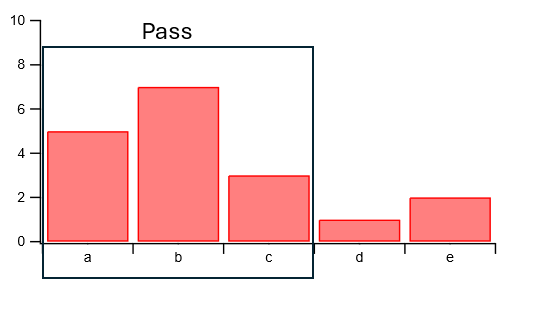
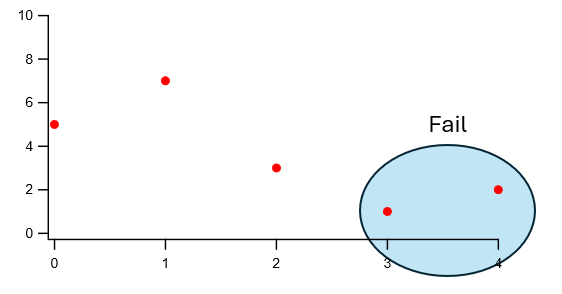
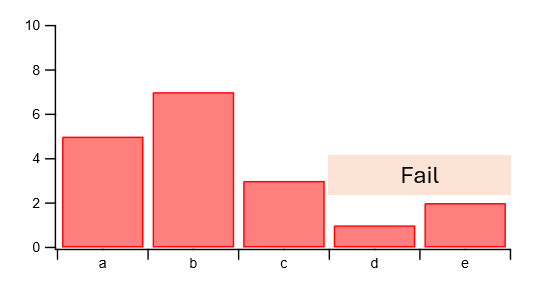
We appreciate the promotion! A lot of what you describe is already available. When you make your text box or rectangle, I would recommend double clicking the draw object and setting the X coordinate system from the default 'Plot Relative' to 'Axis Bottom'. That will let your rectangle span X values instead of pixels, so it stays where you intend it to be when the graph window is resized. The same can be done for any draw object that you put onto a graph. Granted, you will need to put the enclosing shape and text in separately, but it is very doable.
As for the curly braces spanning categories in your third example, that's a feature that is planned for Igor 11, and already ~mostly~ implemented. It will allow you to specify which data points to span, the text to append above it, and also how multiple curly brace spans are organized amongst each other. Let me know if you have other suggestions for what that feature should eventually look like. We mostly imagined it as a better way to append statistical annotations to a data set.
November 3, 2026 at 09:56 am - Permalink