Planck Distribution Plot

Overview
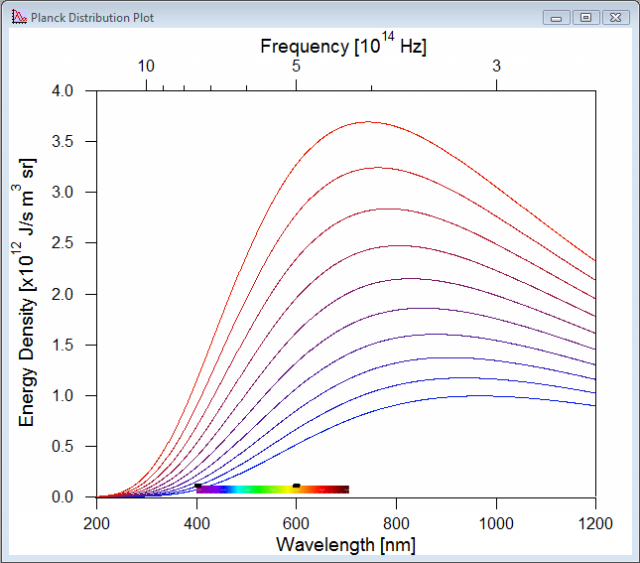
This is a demo experiment that shows the Planck distribution versus wavelength as a function of temperature. The intent is to allow someone to see what the spectral distribution is from a black-body radiator at a given temperature. Programmers can also make use of the Planck distribution functions in the procedure file (wavelength and frequency forms are given).
Features
A graph shows ten radiation curves in the wavelength range 200 nm to 1200 nm. A frequency axis is given at the top, and a rainbow window is included in the graph to show the range of visible light.
A panel input allows you to change the lower temperature and step size of the ten curves.
Distribution Details
- Experiments: PlanckDistributionDemo
- Procedure Files: none
- XOPS: none
- Demos: none
- Requires Packages: Transform Axis (provided by Wavemetrics)
- Benefits from Optional Packages: none
- Help Files: none
- Documentation: the Web pages for this project and a notebook
Installation
Unzip the archive and double click on it. It should be self-contained.
Images:

Project Details
Current Project Release
Planck Distribution Plot IGOR.6.03.x-1.1-1
| Release File: | Planck Distribution.zip (91.55 KB) |
| Version: | IGOR.6.03.x-1.1-1 |
| Version Date: | |
| Version Major: | 1 |
| Version Extra: | 1 |
| Version Patch Level: | 1 |
| OS Compatibility: | Windows Mac-Intel |
| Release Notes: |
This update increases the precision of the constants. |

Forum

Support

Gallery
Igor Pro 10
Learn More
Igor XOP Toolkit
Learn More
Igor NIDAQ Tools MX
Learn More