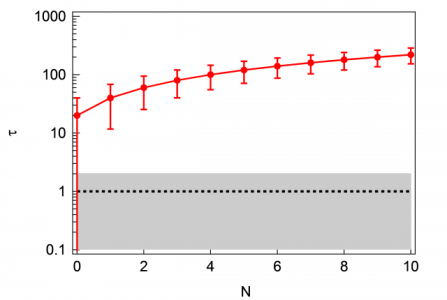
Create plot with a specific color gradient background?
I am trying to create a plot with a color gradient background (see attached image). I have some data on X-Y, and I want to compare them to certain distribution as the background. However, for the background (currently the grey part in the image) I would like to apply a color gradient that is proportional to the probability density of a distribution (e.g. exponential distribution). Is there a straightforward way to do this? Thanks in advance.
Best,
William
p.s. currently I drew the grey background using two points and fill to zero options in Igor figure.


John Weeks
WaveMetrics, Inc.
support@wavemetrics.com
February 9, 2015 at 09:48 am - Permalink
February 9, 2015 at 01:31 pm - Permalink
1) Use my suggestion, but when you add the trace to the graph use
AppendToGraph/VERT gradientWave2) Make a suitable matrix wave and fill it with appropriate values from your distribution, and display that matrix as an image. Use the Grays color table.
Solution 2 will allow any arbitrary gradient.
John Weeks
WaveMetrics, Inc.
support@wavemetrics.com
February 10, 2015 at 09:32 am - Permalink
February 10, 2015 at 03:28 pm - Permalink