How to input value from its x-axis value but not from the point position


I added two functions in a menu. One targets individual spectrum ratio metric measurement and another targets all spectra in the same graph.
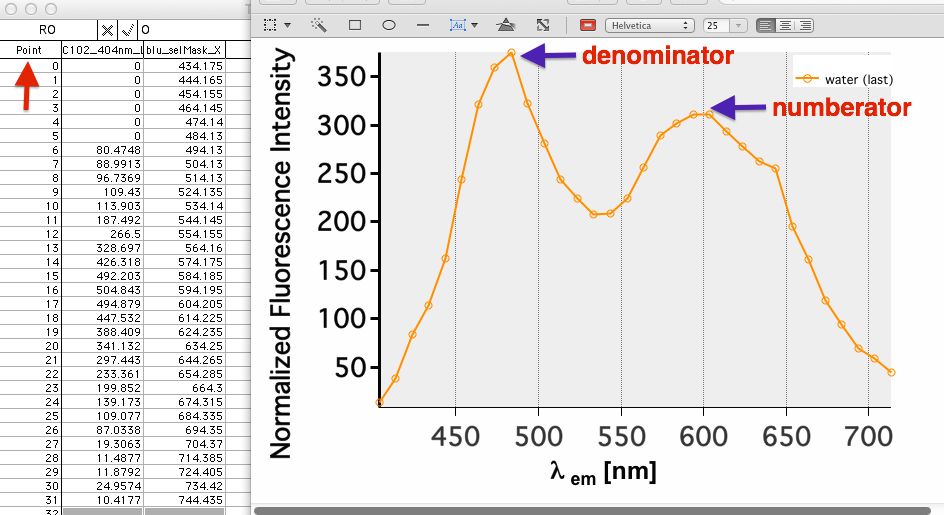
To obtain ratio value, i have to select two points in spectrum (one call donor; another call acceptor). The numberator and denominator positions are not constant in my experiments, so I have to create an input window for specific ratio measurement.
Here, the number that I use is based on point position (red arrow). Now, I would like to use lambda position (blue arrows) to define the ratio, can you point me how to do it?
Here is the code:
Menu "Ratiometric",dynamic
	TraceNameList ("",";",1), donor_acceptor()
"Ratio all",   donor_acceptorAll()
End


Function donor_acceptor()
 	variable donor
	variable acceptor
	prompt donor,"donor peak"
	Prompt acceptor,"acceptor peak"
	Doprompt "Enter values", donor,acceptor
	if (V_flag == 0)
		ratiometric(donor, acceptor)
	endif
end

Function ratiometric(donor,acceptor)
variable donor,acceptor
	GetLastUserMenuInfo		// sets S_value, V_value, etc.
	ratiometric_value(S_value,donor,acceptor)
end

Function ratiometric_value(tracename,donor,acceptor)
string tracename
variable donor,acceptor
wave w= traceNametowaveRef("",traceName)
	wavestats/q w

	variable xPeak = V_maxloc
	VARIABLE ratioValue = w[donor]/w[acceptor]
	String TextItRatio
	sprintf TextItRatio, "\\Z09 \\K(0,65280,0)\\ON  \rRatio=%g",ratioValue
		Tag /F=2/S=3/A=MT/B=(0,0,0)  $tracename,xPeak, TextItRatio

End

Function donor_acceptorAll()
 	variable donor
	variable acceptor
	prompt donor,"donor peak"
	Prompt acceptor,"acceptor peak"
	Doprompt "Enter values", donor,acceptor
	if (V_flag == 0)
		ratiometricall(donor, acceptor)
	endif
end

Function ratiometricall(donor,acceptor)
variable donor,acceptor
	String list = TraceNameList("", ";", 1)
	String tracename

	Variable index = 0
	do
		traceName = StringFromList(index, list)
		if (strlen(traceName) == 0)
			break // No more traces.
		endif
	 ratiometric_value(tracename,donor,acceptor)
		index += 1
	while(1)
end
Thank you very much! Sorry for redundant or messy coding
If you do this, then remember to use parentheses to index into the wave with scale values. That is change
to
Let us know if the above suggestion helps. If not, then maybe you need to clarify your request.
July 13, 2015 at 07:49 am - Permalink
Thanks!
July 13, 2015 at 09:31 am - Permalink
You could also get the scaled or point position by showing the graph info bar (Control-I, OR Graph Menu > Show Info), placing a cursor on the trace and moving to the point of interest. The info bar at the bottom of the graph will show the x & y values of the point and the point position.
July 13, 2015 at 11:01 am - Permalink