Converting histogram bins to actual raw values


Hello all,
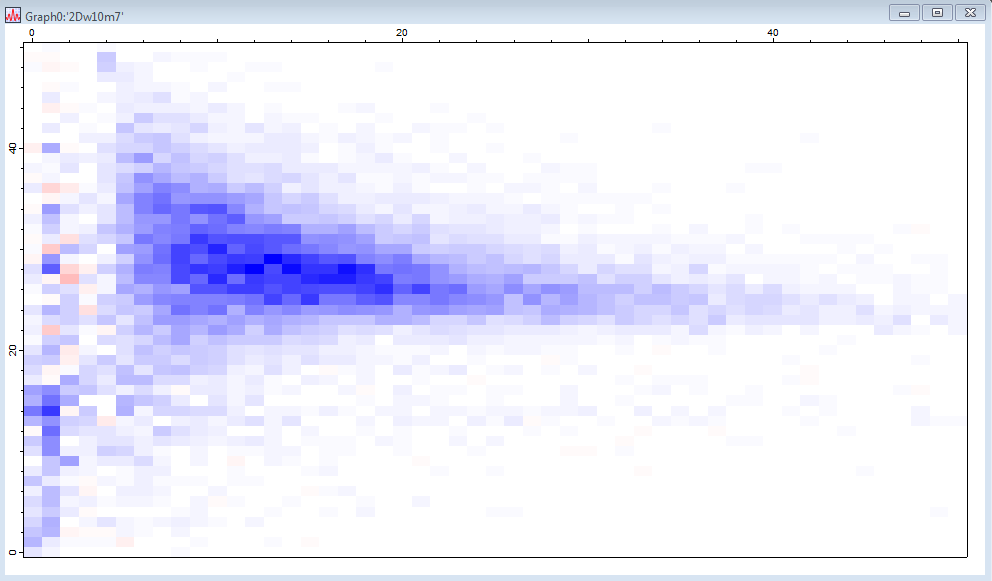
I have created a 2D wave that is a 2D histogram of two different waves. When I "create a new image" the 2D histogram's axes are in bins. How can I convert those bins to raw values? For example if the bottom axis is energy, I would like to see the actual MeV values that the bins correspond to, rather than row 1 to 2 and column 1 to 2, etc. Is there a way to display an image with a converted corresponding axis?
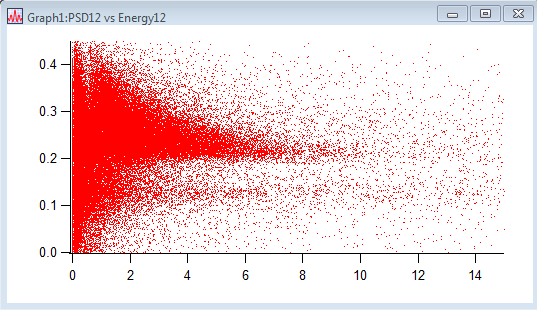
Alternatively, I can achieve this by doing "Display x vs. y", but I need to be able to subtract them. Is there a way to save a displayed graph to operate on? I hope this makes sense.
I attached the 2D image of what I have, and a scatter plot of what I would like to have.
Thank you

Forum

Support

Gallery
Igor Pro 10
Learn More
Igor XOP Toolkit
Learn More
Igor NIDAQ Tools MX
Learn More
A cheat is to make a label wave and a wave for the location of the tick labels. The proper way is to change the wave scaling of your 2D wave.
August 28, 2018 at 02:25 pm - Permalink
Igor's Histogram operation changes the wave's scaling to reflect the bin values.
August 28, 2018 at 05:19 pm - Permalink