.ibw file, multidimensional wave, auxiliary x and y points


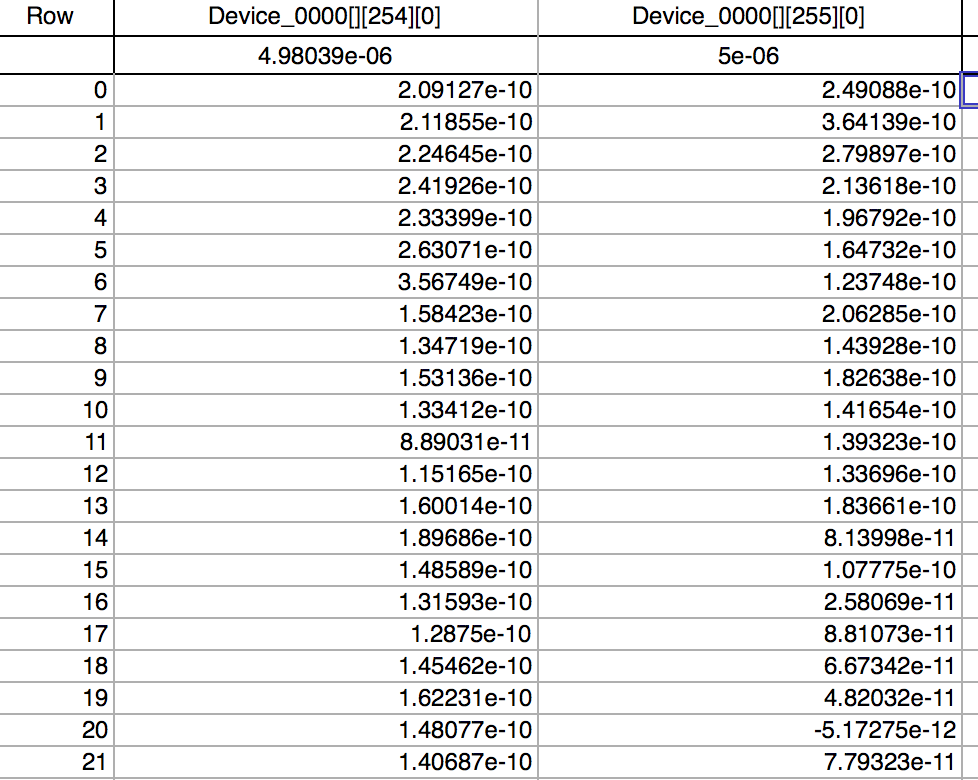
When I make a table of data from .ibw file (AFM image file by Asylum research software), I get the following table. I'd like to access to topmost row, which indicates the x point. However, I am not sure what indexing I should use. Can anyone please help me how I can get an access to this topmost row? Thanks in advance!

Forum

Support

Gallery
Igor Pro 10
Learn More
Igor XOP Toolkit
Learn More
Igor NIDAQ Tools MX
Learn More
What you see in the topmost 'row' (actually not a real row but a 'label' of each column) is most probably the y-scaling of your data. You can change the wave's scaling either directly via the data browser or from the menu by going to 'Data => Change Wave Scaling ...'. To read more about scaling execute the following in the command line:
September 6, 2018 at 11:24 pm - Permalink
Yes, that row shows the Y scaling of your wave. To learn more, execute DisplayHelpTopic "The Waveform Model of Data" and DisplayHelpTopic "Multidimensional Waves".
To get a Y value (yes, we call it Y even though it is the horizontal dimension in a table) you can do this:
Replace "colnum" with the actual column number of your wave.
September 7, 2018 at 09:30 am - Permalink
To be precise, it is a "Y index value", analogous to the "X index values" displayed vertically.
September 7, 2018 at 10:17 am - Permalink