How to create a Source-Destination Circular Diagram?


Hello,
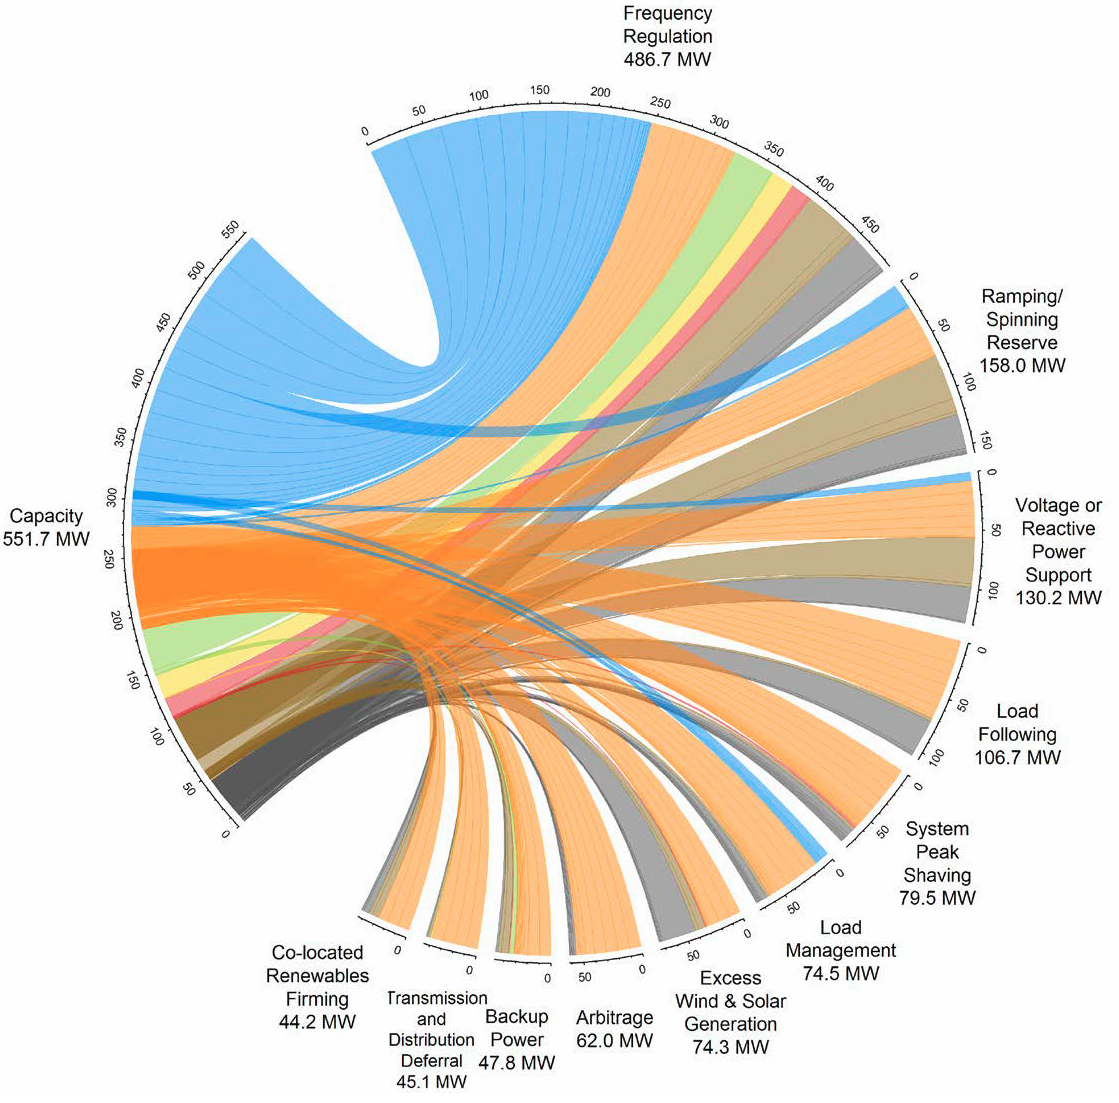
is there a way to create circular diagrams similar to the attached example in IGOR?
Apart from looking fancy, it seems to be a convenient way to visually compare different variants in a complex set of options. If I knew the correct naming of that diagram style, the topic description would have been more precise...
Any suggestions are welcome.
Regards,
Thomas

Forum

Support

Gallery
Igor Pro 10
Learn More
Igor XOP Toolkit
Learn More
Igor NIDAQ Tools MX
Learn More
I believe they are called circos plots and the linear version is a sankey diagram.
November 8, 2018 at 09:32 pm - Permalink