Making a donut plot in IGOR


Hi,
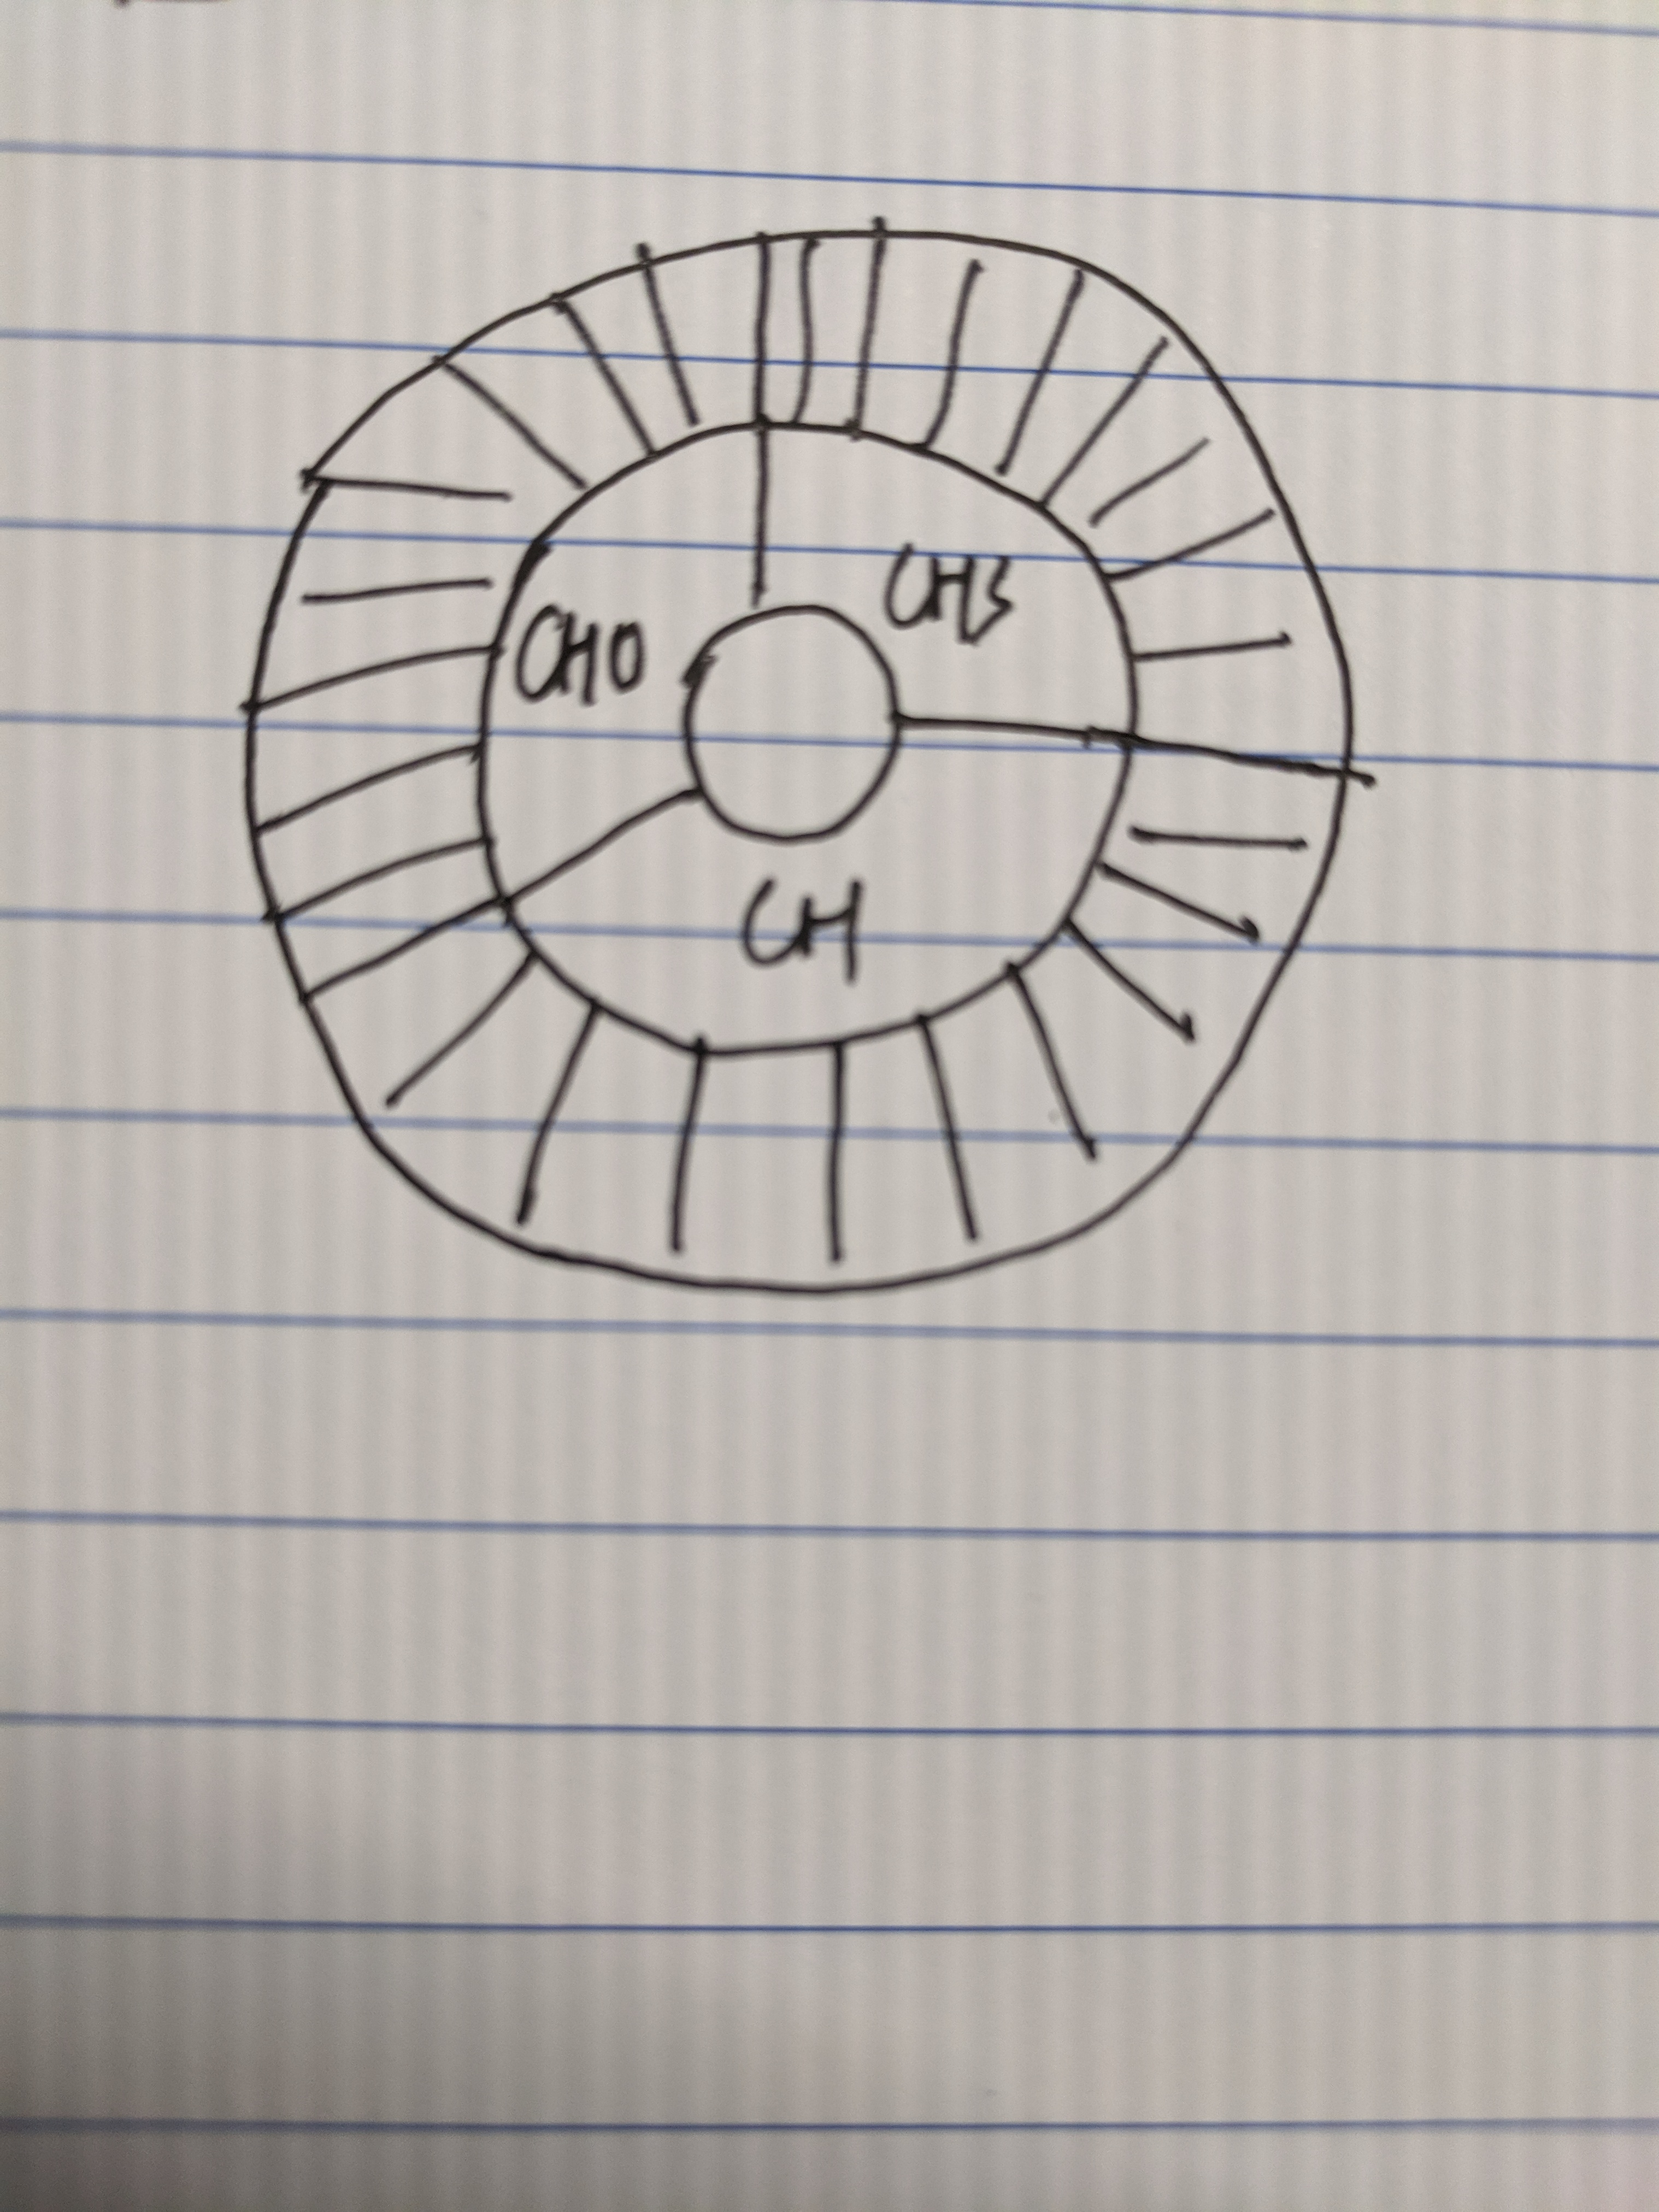
I want to create a 2D-donut plot with multiple layers. Please see the attached image. I couldn't find a way to do this in IGOR. Kindly help. Thanks a ton!
Sincerely,
Peeyush

Forum

Support

Gallery
Igor Pro 10
Learn More
Igor XOP Toolkit
Learn More
Igor NIDAQ Tools MX
Learn More
This looks like three pie charts stacked up? The outer ring in back, then the inner ring, finally the circle in the middle? Possibly you could use Igor's pie chart package (Windows->New->Packages->2D Pie Chart) to make the individual pie charts, then composite them in a page layout.
October 8, 2019 at 10:58 am - Permalink
You may also want to check out File Menu->Example Experiments->Visualization->wedges for a 3D version.
October 9, 2019 at 03:57 pm - Permalink
I've made some changes recently to the 2D Pie chart procedures (attached) that might help.
These procedures are scheduled to ship with Igor 8.04, but should work on Igor 6.37, too.
Replace the same-named files in your WaveMetrics Procedures/Graphing and /Windows folders.
October 9, 2019 at 05:53 pm - Permalink