How to add correct axis for Gizmo image?


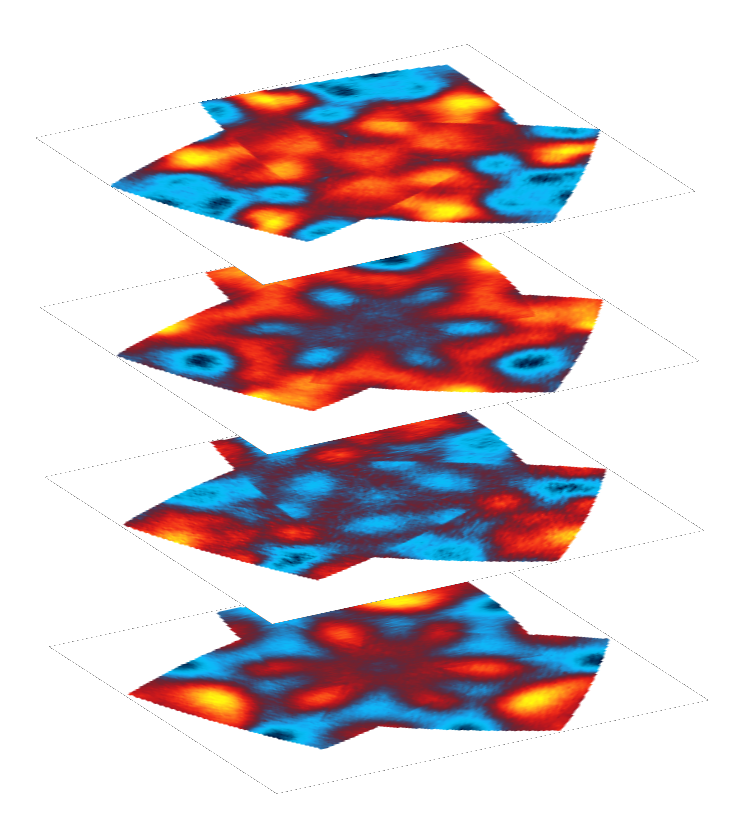
I added several images to the Gizmo with different z offset values to form a column. But when the images appear in the Gizmo, their original coordinates disappear. How to add correct axis for Gizmo image? I tried to add axis from object list but I can only add the axis for one of the four images and the coordinates range are wrong. When I set axis range it doesn't work or show set outbox limits wrong.
Interesting graph but we need more information. Ideally, you could send a copy of your experiment to support@wavemetrics.com and we will try to help you directly.
There are several ways to create a composite as shown above. In each case, the approach for adding axes would be different. Off-hand this looks to me like a stack of images where the lower image is drawn first and higher images are drawn on top with partial overlap. If these are Gizmo Images that are offset using internal parameters you would need one global object to provide scale and dimensions for an axes object. One way to accomplish that is to create a triplet wave that contains 3 xyz rows defining the min and max in each direction. You can then add this as a scatter object with zero size markers. Once you have such an object on the display list you can manipulate the range of the axes as you desire.
A.G.
May 6, 2022 at 08:57 am - Permalink
Thank you for your help.
May 6, 2022 at 07:14 pm - Permalink