Igor wave display


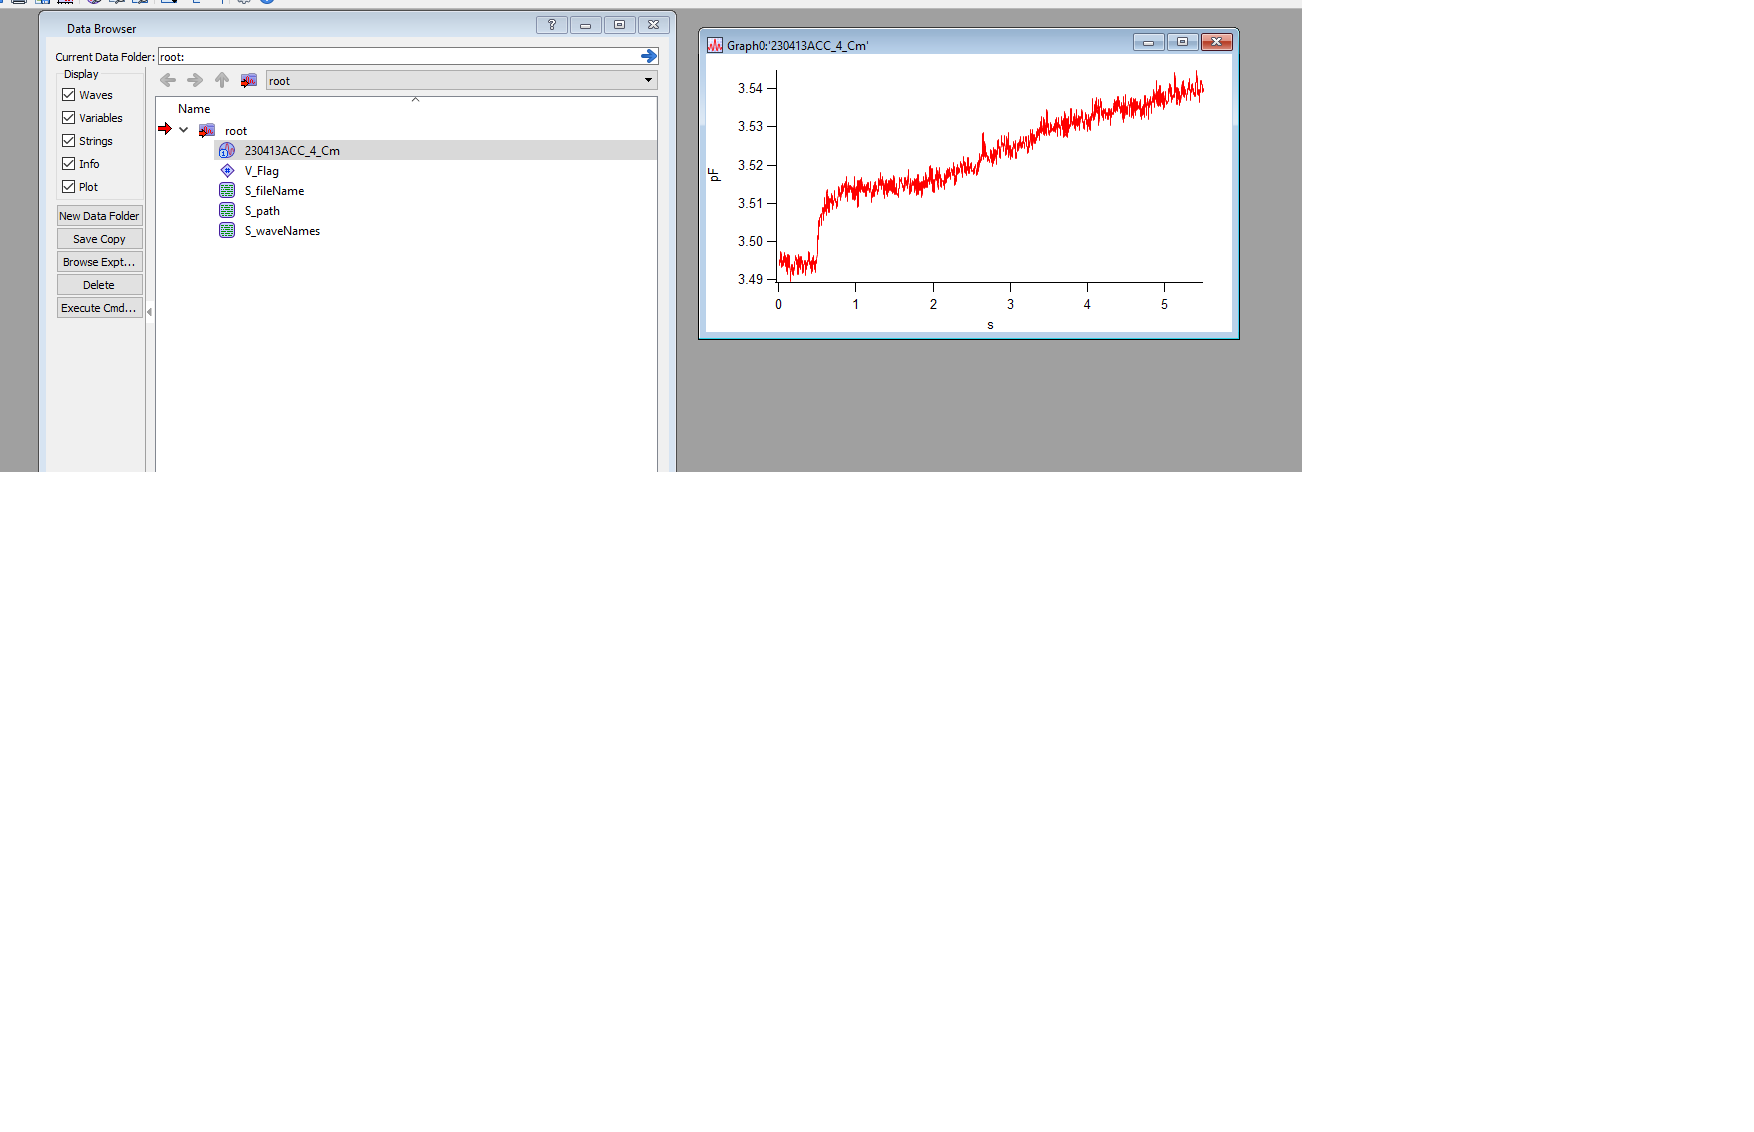
I have an Igor wave which I extracted from electrophysiological recordings. When I display the wave, I can see the graph that I want but when I double click the wave to look through the points, the wave looks empty. Can anyone help figuring out why is this happening?
I attached the picture of the displayed wave and the wave itself.
Many thanks in advance!
When I display the wave in a table
I see it has NaNs for points 0-11 and then the data starts, i.e. if I scroll down the table a bit I can see the data.
April 27, 2023 at 01:52 pm - Permalink