Extending a trendline beyond the data markers


Hi,
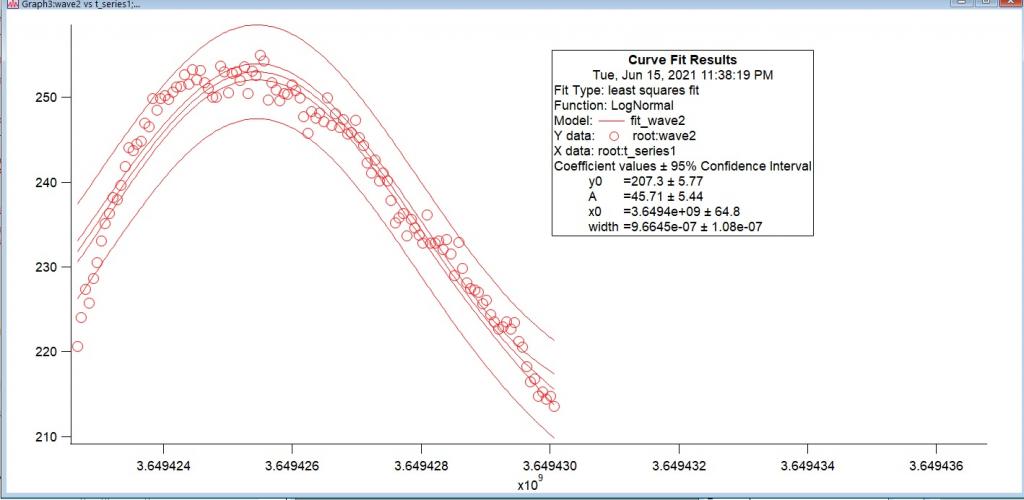
I'm in need of help.. In the graph below, I want to extend the shown lognormal trendline over the remaining part of the x-axis. The circles are actual data but they stop midway on the x-axis. I couldn't figure out how to do this. Kindly advise. I don't care about the confidence intervals in this case, just need the mean trendline extended.
Sincerely,
Peeyush
Hi,
Have you tried the X Range Full Width of Graph option. I know this works for linear fits and should work here.
Andy
June 15, 2021 at 03:05 pm - Permalink
Thanks a lot, Andy! It did work!
June 16, 2021 at 01:14 am - Permalink