

Why my wave seems so werid.



Hello, I'm a beginner for Igor Pro 10. I met a problem when I load my patch clamp wave from HEKA's patch master software. When i open a itx. data, the wave seems normal,but soon become weird.
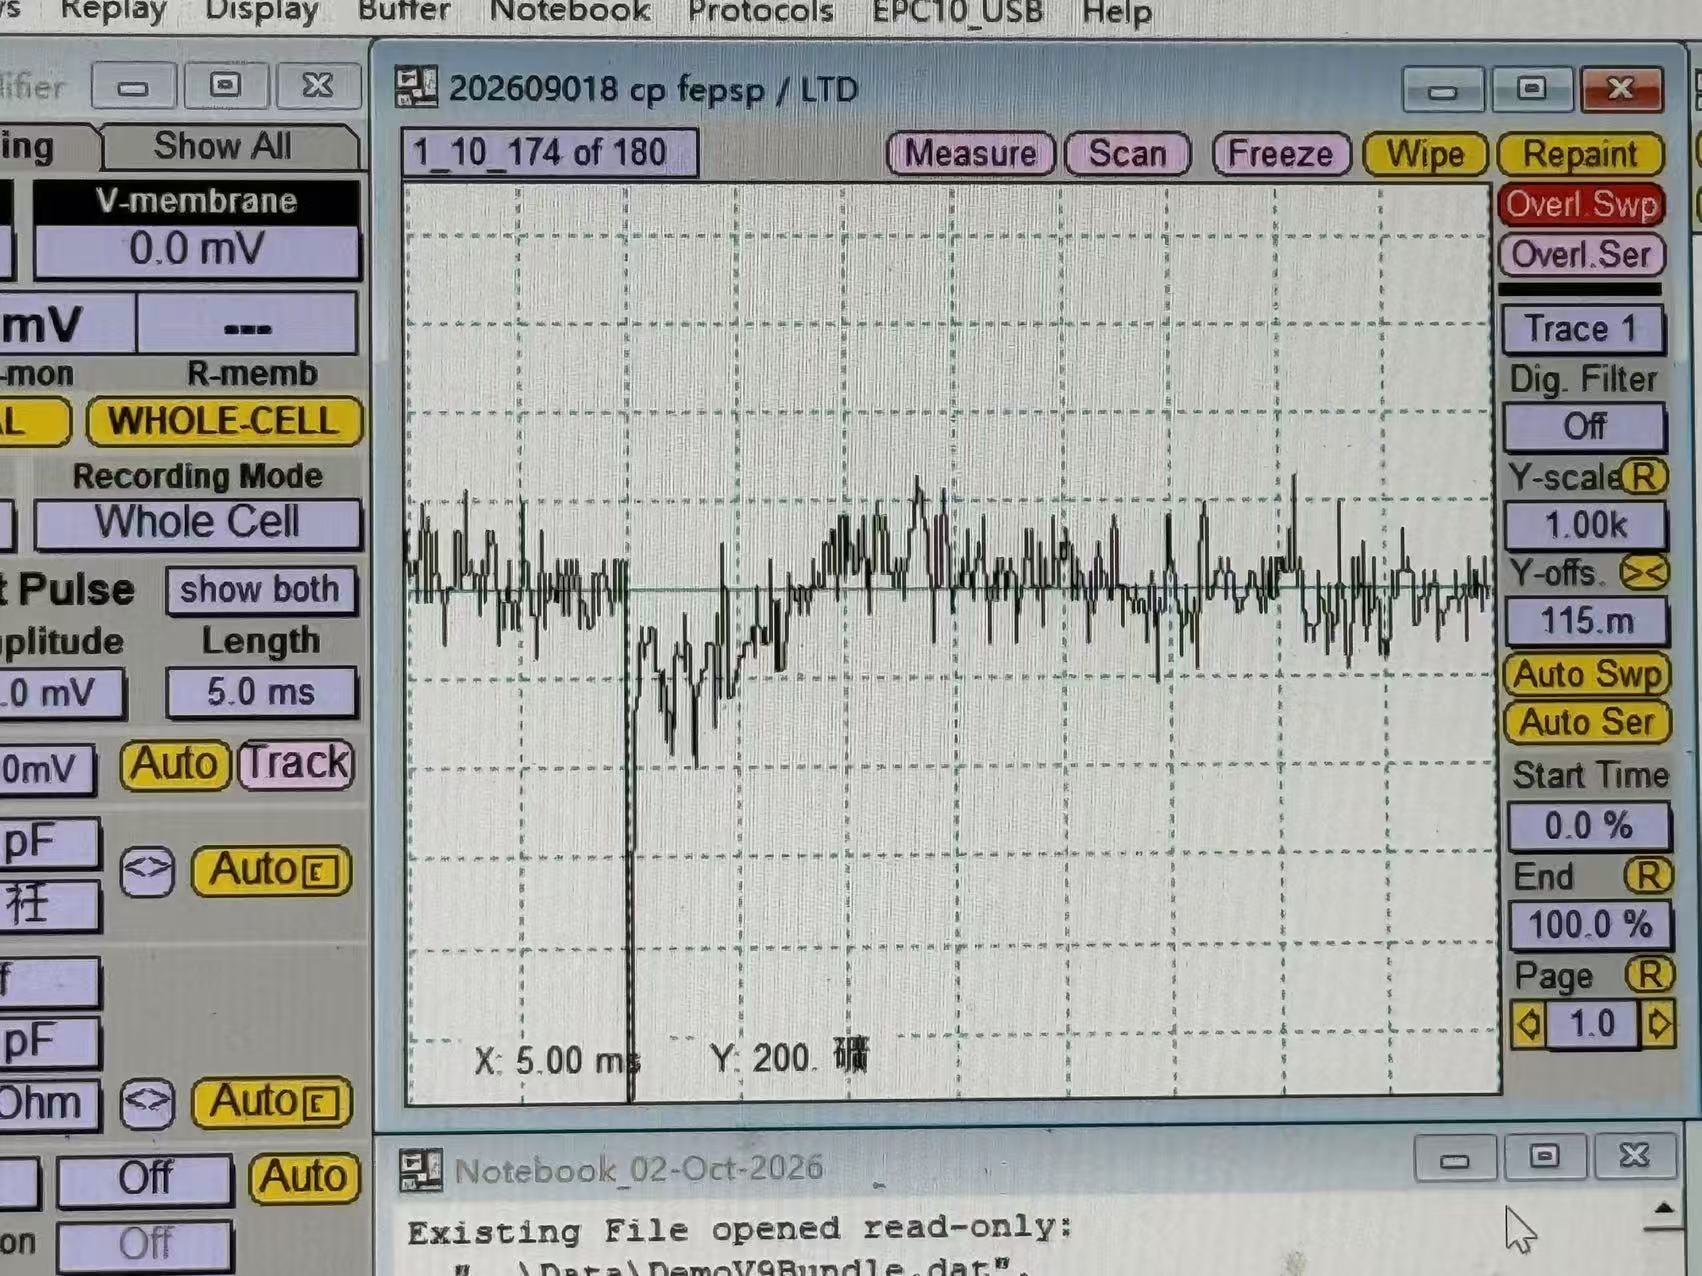
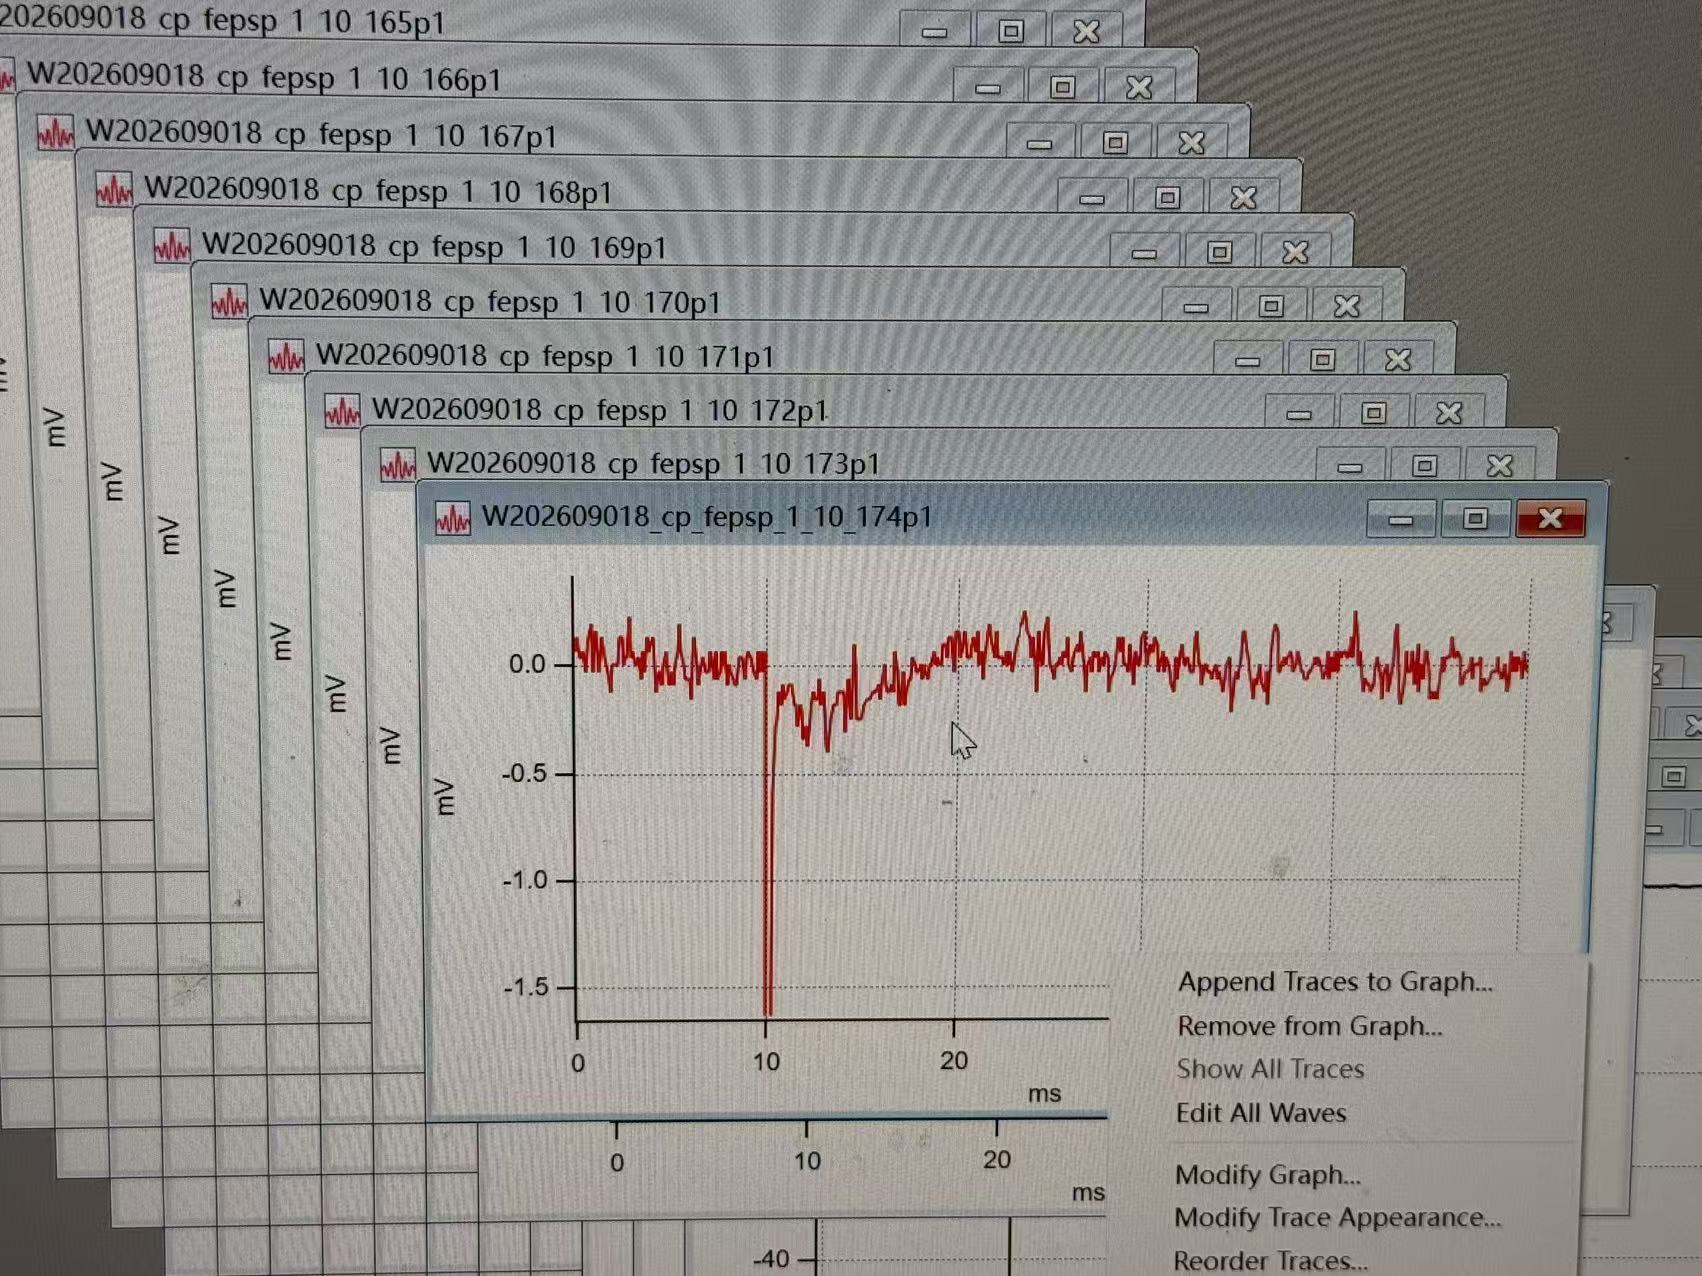
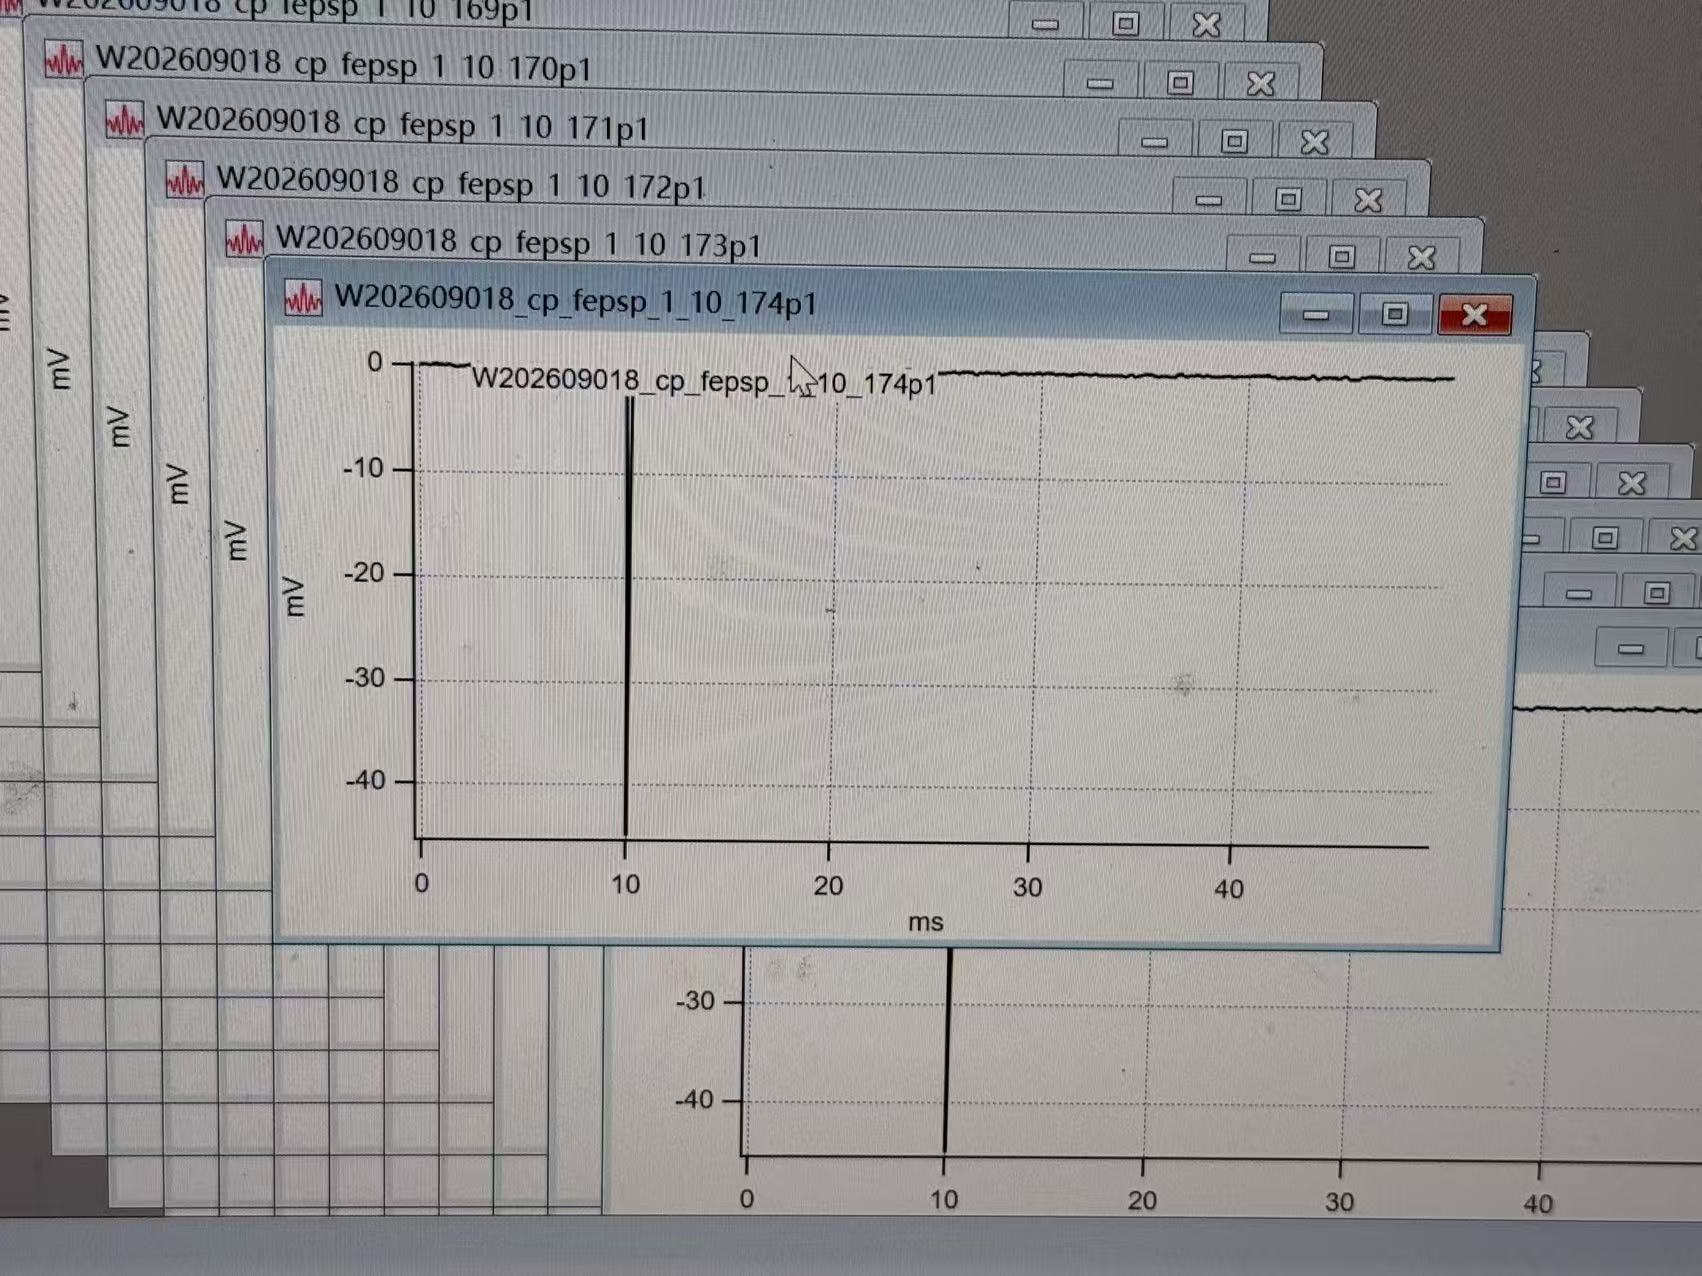
The first pic is my original wave in patch master. The second pic is normal,but soon in third pic it becomes werid.
Dose any know how to solve this problem.
Thanks for your help!
I expand this wave it seems too smooth
October 1, 2026 at 10:24 am - Permalink
The difference between your red trace and black trace appears to be that the y scaling is different. In the red trace image the y scaling is roughly +0.5 to -1.6 mV, and in the black trace it's roughly 0 to -45mV. I don't know if that's what you consider to be "weird" though.
October 1, 2026 at 11:50 am - Permalink
In reply to The difference between your… by aclight
Hu BichengThanks for your reply and apologize for my inaccurate expression. Actually, I tried to adjust y and x axis, when I expand the details I found the wave become too smooth,The rough noise and small fluctuations that were present in the original file have disappeared. That’s what I mean by weird.
October 1, 2026 at 04:54 pm - Permalink
The expansion is a factor of 1000 from ms (the "original" view) to ns (the "expanded" view). Start a new Igor Pro experiment. Put this function in the procedure window. Run it from the command line as show_change(). View the two graphs side by side. The two graphs are showing the same data. Yet the Expanded View looks "smoother".
The "smoother" view in the expanded window is because you are zooming in and arriving in between the fluctuating signal.
Does this example answer your question?
October 1, 2026 at 06:13 pm - Permalink
In reply to The expansion is a factor of… by jjweimer
Hu BichengThanks for your help, I understand the change between original data and expand data by the example, but there is another problem, when I open this data the original red trace soon disappeared, and the smooth trace replace the red trace windows. How can I found my red trace back to analyze my data. I recorded a video showing the specific issue. I would really appreciate it if you could take some time to have a look at it.
October 1, 2026 at 06:49 pm - Permalink
Unfortunately, I cannot understand the message that should be learned from the video. Why does the video show a (very) large number of graphs opening on the screen? Is your experiment having this many graphs?
In the meantime, do these steps:
- Start from the beginning. Open the original data file in Igor Pro. Save the experiment as Example 1.
- Do your processing. Go to a point where you see the problem. Save the experiment as Example 2.
Post Example 1 and Example 2 in a ZIP archive.
October 1, 2026 at 07:06 pm - Permalink
Append one of your itx files. I suspect you are importing large number of itx files which contain data, plot, and the some post processing steps. The itx file may contain processing of data, here is example snippet chatGPT Igor Pro Wizard generated for me:
So if your itx file includes post processing, you will get different data than original noisy collected data which may flash briefly on the screen. itx file is simple text, so you can inspect it in any text editor - look for lines starting with X.
October 1, 2026 at 07:48 pm - Permalink
In reply to Unfortunately, I cannot… by jjweimer
Hu Bichengjjweimer wrote:
Unfortunately, I cannot understand the message that should be learned from the video. Why does the video show a (very) large number of graphs opening on the screen? Is your experiment having this many graphs?
In the meantime, do these steps:
- Start from the beginning. Open the original data file in Igor Pro. Save the experiment as Example 1.
- Do your processing. Go to a point where you see the problem. Save the experiment as Example 2.
Post Example 1 and Example 2 in a ZIP archive.
Yes,I have many wave to analyze. But unfortunately, I meet some problem when I save the data as pxp. data, when the pxp data open i only see the smooth data, but the original data disappear. To better demonstrate the problem I’m experiencing, could I post a itx. data and original data from patch master? The problem is when I open the itx. data the rough wave appear, but soon it becomes smooth, and i can't find it back. If you meet the looking for "path" when open itx.data, please press yes and open button. It's maybe a bug for heka's software.
Thanks again for your help!
October 1, 2026 at 08:03 pm - Permalink
In reply to Append one of your itx files… by ilavsky
Hu BichengThanks for your help! I check the itx. file, It seems like the software export the data get wrong.
The code
X GBLoadWave /B/O/N=HEKAwave/T={16,2}/Y={0, 3.121978597E-05}/W=1/U=500/S=235304/P=W202609018_cp_fe_Path "202609018 cp fepsp.dat"
It seems like original data is 32 bit type but in itx. data it becomes 16 type, I change the code ''T={16,2}'' into ''T={32,2}'', the wave become normal, but it appear two wave.But i can adjust x axis to solve this problem.
Thanks a lot!
October 1, 2026 at 10:29 pm - Permalink
In reply to Unfortunately, I cannot… by jjweimer
Hu BichengThanks for your help! According to ilavsky's suggestion.I check the itx. file, It seems like original data is 32 bit type but in itx. data it becomes 16 type, I have been solved this problem.
Thanks a lot!
October 1, 2026 at 10:31 pm - Permalink
I loaded your example file. I really think what you are seeing is caused by a change in the graph's vertical scale.
When I loaded the file, I got 188 graphs, all very similar. All the graphs have auto-scaled axes.
I see in your middle picture that the large negative spike is truncated. In your third picture is not truncated. The "smoothing" you see in the third picture is simply a result of showing that noisy data to the right of the spike displayed over a much smaller part of the screen. There are very few pixels used to show the noise in the third picture.
Further, the .itx file has a bit of weirdness. Here are the lines from the .itx file that loads and displays one data set:
The difference in the vertical scale is a factor of about 16.
October 6, 2026 at 02:05 pm - Permalink
I meant also to note that the waves I loaded are all 32-bit floating point number type. I wonder how you concluded that yours are have been altered from 32-bit (integer?) to 16-bit?
October 6, 2026 at 02:08 pm - Permalink
In reply to I meant also to note that… by johnweeks
Hu BichengThanks for your reply. Actually I made a mistake, I meant the original data were recorded in 16-bit format, but when exporting the ITX file, the data were read as binary using the code. And the chatgpt told me original data could be recorded by both 32bit or 16bit.So I thought that could be the problem.But from your help it may just a display problem.
October 6, 2026 at 05:47 pm - Permalink