Thanks for the cool things!


Some folks tend to jump to Excel for their data analysis. I admit, some things just are far easier to do using a spreadsheet app (e.g. calculating the running average and standard uncertainty values across columns of data across a set).
But, there are some things that cannot be beat in Igor Pro.
By example, I was setting up an experiment to process a sequence of replicant experiments. I was demonstrating my steps to someone (on a Zoom session). I pulled up the data browser, zeroed in on a wave, and context-clicked to Display the wave. Then, I moved through other data folders, grabbing the equivalent waves in each and doing a drag+drop onto the graph that I had produced for the first wave. The graph built to a display as shown below.
This is when I heard the statement "That is cool!"
And I will say, even I was saying about the same thing to myself (albeit because I was excited about the physical meaning of the results that were being revealed, but ... hey).
So, thanks WaveMetrics for the cool things that we can do with Igor Pro!
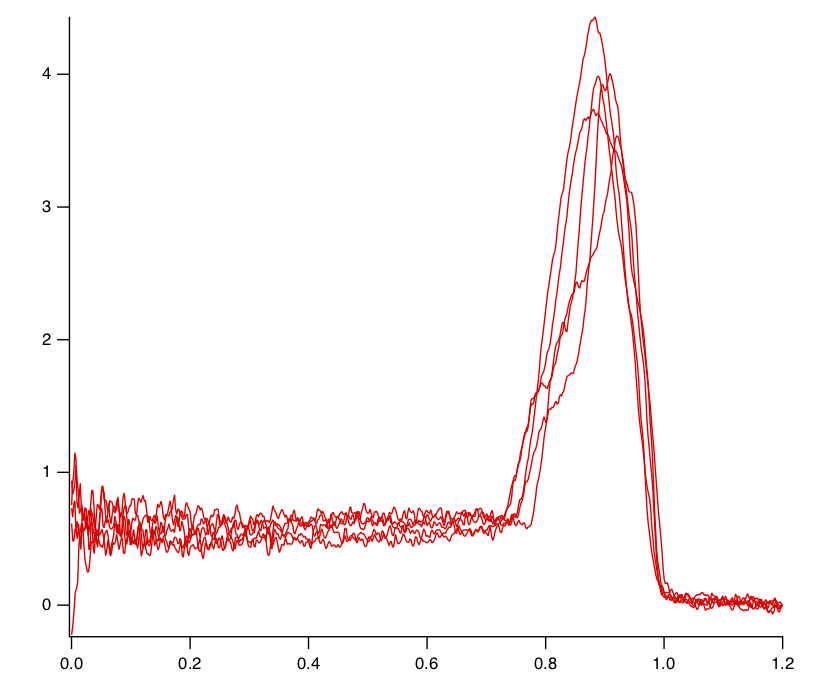
The feature I get the most "cools" on is what I call the "marketing function", dragging a wave on the graph to look for shape similarity and the like.
Andy
July 28, 2020 at 07:29 pm - Permalink
Thanks!
IP9 has enhanced drag-and-drop from the DataBrowser to a graph. Drop in the middle is just like it is now, but there are drop targets that allow you to put it on the right or top axes, or make a new free axis. If you drag more than one wave, you will get a dialog allowing you to designate one wave as an X wave. Existing axes are drop targets, too.
July 29, 2020 at 09:36 am - Permalink
I don't often have the opportunity to show off Igor directly. But with the features already built in and some little tool sets I wrote over the years I can now load data (with a script to do the dirty work for me), normalize and scale/shift the axes (you can apply it to the data or just the graph, fantastic), calculate differences between datasets or determine any skew / background, and put everything in a nice graph literally in seconds! I then breeze through a full analysis (re-normalization against several parameters, fitting, meta-fitting of the results, comparison to references etc pp., also thanks to the command line) of a measurement in maybe half a hour. Even working through a large data set takes me often less than a day. So my colleagues often say 'what? you are already done with that? HOW?'. I do not know enough Excel-trickery to do a meaningful comparison, but I cannot imagine such things can be done in a reasonable time or at all. So I would agree fully. I think for a beginner, Excel and the like looks more appealing since you get things done by literally fiddling with the data directly. But this gets tedious fast. I am happy that wasting about half of my time in my university days on practicing with Igor saves me now at ton.
July 29, 2020 at 11:28 am - Permalink
On a similar note to the original feature that was mentioned, starting from Igor 8 you can drag graph, table, and Gizmo windows from the Window Browser onto a page of a page layout.
Also, in case you missed it, you can drag a wave from the Data Browser onto a table window as well.
July 29, 2020 at 12:50 pm - Permalink
Looking forward to the new drag-and-drop features in IP9. I recently learned JMP, and its Graph Builder that mostly uses drag-and-drop is amazing for quickly looking at data in different ways.
July 31, 2020 at 08:36 am - Permalink