heatmap with text annotations


Hi everyone!
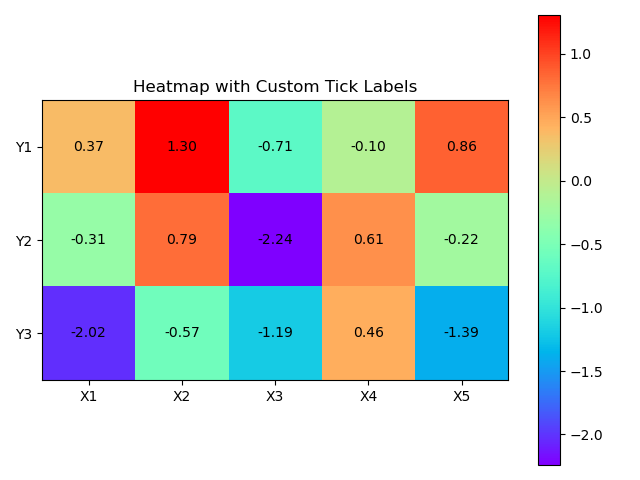
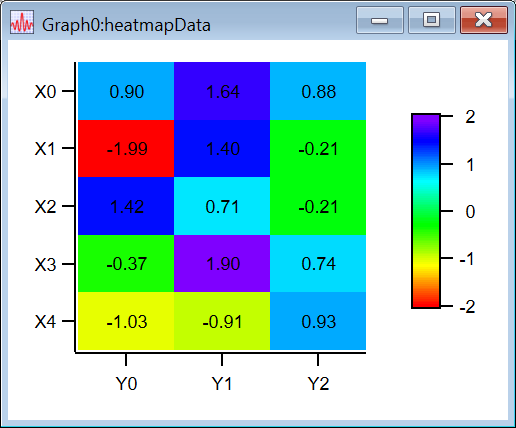
I'm trying to plot a heatmap with text annotations in Igor Pro. Below is a minimal working example (MWE) that demonstrates what I want to achieve.
However, it seems that the 2D wave gets transposed during imaging (`AppendImage`), which makes it confusing to correctly place text annotations and set tick labels. I have to treat rows as columns (and vice versa) to compensate for this behavior, which feels counterintuitive and goes against the literal meaning of the variable names.
Is there a more elegant or idiomatic way to handle this in Igor Pro?
Here is the MWE in Igor Pro:
#pragma TextEncoding = "UTF-8"
#pragma rtGlobals=3		// Use modern global access method and strict wave access.

Function heatmap()
	// == Input Wave ==
	SetRandomSeed 3389
	make/O/N=(3,5) heatmapData = gnoise(1)

	// == Imaging ==
	Variable numRow = DimSize(heatmapData, 0);
	Variable numCol = DimSize(heatmapData, 1);
	Make/O/N=(numCol,numRow) heatmapDataTransposed = heatmapData[q][p]

	printf "(Debug) numRow: %d, numCol: %d\n", numRow, numCol

	Display
	AppendImage heatmapData
	ModifyImage heatmapData ctab= {*,*,Rainbow,0}

	make/O/N=(numCol) xTick = p
	make/O/N=(numRow) yTick = p

	Make/O/T/N=(numCol) xTickLabel
	Make/O/T/N=(numRow) yTickLabel

	Variable row, col
	String xTickStr, yTickStr
	for(col = 0; col < numCol; col++)
		sprintf xTickStr, "X%d", col
		xTickLabel[col] = xTickStr
	endfor

	for(row = 0; row < numRow; row++)
		sprintf yTickStr, "Y%d", row
		yTickLabel[row] = yTickStr
	endfor

	ModifyGraph userticks(left)={xTick,xTickLabel}
	ModifyGraph userticks(bottom)={yTick,yTickLabel}

	ModifyGraph width={Aspect,1}
	SetAxis/A/R left
	ColorScale/C/N=text0/F=0/Z=1/B=1/A=RC/E image=heatmapData,axisRange={-2,2}

	Variable xAttach
	String tagName, textLabel
	for (col=0; col < numCol; col++)
		for (row = 0; row < numRow; row++)
			xAttach = Sub2Ind({numRow, numCol}, {row, col})
			sprintf tagName, "tag_%d_%d", row, col
			sprintf textLabel, "%0.2f", heatmapData[row][col]
			print tagName, xAttach, textLabel
			Tag/C/N=$(tagName)/F=0/B=1/Z=1/X=0.00/Y=0.00/L=0 heatmapData, xAttach,textLabel
		endfor
	endfor
End

Function Sub2Ind(dimSizes, indices)
    // dimSizes: 1D wave of sizes, e.g. {3,4,5}
    // indices:  1D wave of 0-based subscripts, e.g. {1,2,0}
    // Returns:  0-based linear index (column-major order)

    Wave dimSizes, indices
	Variable numDimensions = numpnts(dimSizes)
	Variable numIndices = numpnts(indices)

	if (numIndices != numDimensions)
		Abort "Number of indices must match number of dimensions"
	endif

    Variable i
    String errorMessageStr
    // Check for out-of-bounds indices
    for (i = 0; i < numDimensions; i += 1)
        if (indices[i] < 0 || indices[i] >= dimSizes[i])
	        sprintf errorMessageStr, "Index out of bounds: indices[%d] = %d, expected 0 to %d", i, indices[i], dimSizes[i] - 1
	        Abort errorMessageStr
        endif
    endfor

    Variable linearIndex = 0
    Variable stride = 1

    for (i = 0; i < numDimensions; i += 1)
        linearIndex += indices[i] * stride
		stride *= dimSizes[i]
    endfor

    return linearIndex
End
For comparison, here's a Python version using `matplotlib` that produces the expected result.
(Note: The random values differ, possibly due to different random number generators, but that’s not a concern.)
import numpy as np
import matplotlib.pyplot as plt

def heatmap_demo():
    # Generate data
    np.random.seed(3389)
    data = np.random.normal(loc=0.0, scale=1.0, size=[3, 5])  # Shape: (rows, columns)
    print(data)

    # Define labels
    num_rows, num_cols = data.shape
    x_labels = [f"X{i + 1}" for i in range(num_cols)]
    y_labels = [f"Y{i + 1}" for i in range(num_rows)]

    # Create the heatmap
    fig, ax = plt.subplots()
    im = ax.imshow(data, cmap='rainbow')

    # Set axis ticks
    ax.set_xticks(np.arange(num_cols))
    ax.set_yticks(np.arange(num_rows))

    # Set tick labels
    ax.set_xticklabels(x_labels)
    ax.set_yticklabels(y_labels)

    # Rotate x-axis labels if needed
    plt.setp(ax.get_xticklabels(), rotation=0, ha="center", va="top")

    # Add text annotations
    for i in range(num_rows):
        for j in range(num_cols):
            text = f"{data[i, j]:.2f}"
            ax.text(j, i, text, ha="center", va="center", color="black")

    # Make layout tight and show
    plt.title("Heatmap with Custom Tick Labels")
    plt.colorbar(im)
    plt.tight_layout()
    plt.show()

def main():
    heatmap_demo()

if __name__ == "__main__":
    main()
what about if you change the make command to:
May 7, 2025 at 06:32 am - Permalink
You may be confused by the table and the image representations of an array within Igor. Note that the 'rows' are always displayed on the horizontal / x axis both in image and line plots while columns run along the vertical / y axis (unless you deliberately swap axes). In a table, however, the representation is flipped, i.e., rows always run vertical and columns horizontal in a table. This has apparently historic reasons, about which you can read more here:
https://www.wavemetrics.com/forum/general/translating-matlab-matrix-mul…
May 7, 2025 at 09:14 am - Permalink
In reply to what about if you change the… by ChrLie
guoqilinThank you for your reply! I worked around the issue in a similar way by using
heatmapDataTransposedinstead ofheatmapData, which makes me feel better.May 8, 2025 at 05:41 am - Permalink
In reply to You may be confused by the… by chozo
guoqilinThank you for clearing that up.
May 8, 2025 at 05:44 am - Permalink